Reno County, Kansas
Reno County (standard abbreviation: RN) is a county in the U.S. state of Kansas. In 2020, 61,898 people lived there.[1] The county seat is Hutchinson. Hutchinson is also the biggest city in Reno County.[2]
Reno County | |
|---|---|
 Reno County Courthouse in Hutchinson (2008) | |
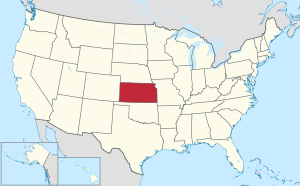
 Location within the U.S. state of Kansas | |
 Kansas's location within the U.S. | |
| Coordinates: 37°57′N 98°05′W / 37.950°N 98.083°W | |
| Country | |
| State | |
| Founded | February 26, 1867 |
| Named for | Jesse Lee Reno |
| Seat | Hutchinson |
| Largest city | Hutchinson |
| Area | |
| • Total | 1,272 sq mi (3,290 km2) |
| • Land | 1,255 sq mi (3,250 km2) |
| • Water | 17 sq mi (40 km2) 1.3% |
| Population | |
| • Total | 61,898 |
| • Density | 49.3/sq mi (19.0/km2) |
| Time zone | UTC−6 (Central) |
| • Summer (DST) | UTC−5 (CDT) |
| Area code | 620 |
| Congressional district | 1st |
| Website | renogov.org |
History
In 1867, Reno County was created.
In 1887, the Chicago, Kansas and Nebraska Railway built a railroad from Herington to Pratt.[3] This railroad connected Herington, Ramona, Tampa, Durham, Waldeck, Canton, Galva, McPherson, Groveland, Inman, Medora, Hutchinson, Whiteside, Partridge, Arlington, Langdon, Turon, Preston, Natrona, Pratt. In 1888, this main line was extended to Liberal. Later, this railroad was extended to Tucumcari, New Mexico and El Paso, Texas. This railroad is called the "Golden State Limited".
Geography
The U.S. Census Bureau says that the county has a total area of 1,272 square miles (3,290 km2). Of that, 1,255 square miles (3,250 km2) is land and 17 square miles (44 km2) (1.3%) is water.[4] It is the third-biggest county by area in Kansas.
People
| Historical population | |||
|---|---|---|---|
| Census | Pop. | %± | |
| 1880 | 12,826 | — | |
| 1890 | 27,079 | 111.1% | |
| 1900 | 29,027 | 7.2% | |
| 1910 | 37,853 | 30.4% | |
| 1920 | 44,423 | 17.4% | |
| 1930 | 47,785 | 7.6% | |
| 1940 | 52,165 | 9.2% | |
| 1950 | 54,058 | 3.6% | |
| 1960 | 59,055 | 9.2% | |
| 1970 | 60,765 | 2.9% | |
| 1980 | 64,983 | 6.9% | |
| 1990 | 62,389 | −4.0% | |
| 2000 | 64,790 | 3.8% | |
| 2010 | 64,511 | −0.4% | |
| 2020 | 61,898 | −4.1% | |
| U.S. Decennial Census[5] 1790-1960[6] 1900-1990[7] 1990-2000[8] 2010-2020[1] | |||

The Hutchinson Micropolitan Statistical Area includes all of Reno County.
Government
Russell county is almost always Republican. The last time a democratic candidate won the county was in 1976 by Jimmy Carter.
Presidential elections
| Year | Republican | Democratic | Third Parties |
|---|---|---|---|
| 2020 | 65.7% 18,443 | 31.7% 8,886 | 2.6% 731 |
| 2016 | 63.2% 15,513 | 27.9% 6,837 | 8.9% 2,186 |
| 2012 | 64.4% 15,718 | 33.1% 8,085 | 2.5% 619 |
| 2008 | 60.6% 16,112 | 37.3% 9,916 | 2.2% 574 |
| 2004 | 65.0% 17,748 | 33.4% 9,114 | 1.7% 462 |
| 2000 | 59.7% 15,179 | 35.5% 9,025 | 4.8% 1,226 |
| 1996 | 54.3% 14,275 | 34.6% 9,108 | 11.1% 2,917 |
| 1992 | 40.1% 11,377 | 32.6% 9,257 | 27.3% 7,738 |
| 1988 | 51.1% 12,753 | 46.3% 11,545 | 2.6% 656 |
| 1984 | 63.3% 16,568 | 35.3% 9,229 | 1.4% 362 |
| 1980 | 52.9% 13,804 | 36.8% 9,615 | 10.4% 2,702 |
| 1976 | 42.3% 11,212 | 55.1% 14,620 | 2.6% 680 |
| 1972 | 63.8% 15,714 | 33.2% 8,183 | 3.0% 731 |
| 1968 | 50.3% 11,804 | 42.1% 9,872 | 7.7% 1,798 |
| 1964 | 36.8% 8,829 | 62.3% 14,936 | 0.9% 208 |
| 1960 | 60.2% 14,655 | 39.3% 9,557 | 0.5% 127 |
| 1956 | 66.6% 15,057 | 33.0% 7,461 | 0.5% 102 |
| 1952 | 68.6% 15,762 | 28.5% 6,555 | 2.9% 666 |
| 1948 | 51.9% 11,187 | 46.2% 9,957 | 2.0% 423 |
| 1944 | 58.7% 11,004 | 40.6% 7,604 | 0.7% 135 |
| 1940 | 53.6% 12,448 | 45.4% 10,543 | 0.9% 217 |
| 1936 | 37.6% 8,607 | 62.0% 14,203 | 0.4% 88 |
| 1932 | 47.3% 8,972 | 49.3% 9,351 | 3.4% 647 |
| 1928 | 76.3% 12,872 | 22.8% 3,843 | 0.9% 153 |
| 1924 | 65.2% 10,339 | 23.2% 3,675 | 11.6% 1,837 |
| 1920 | 67.1% 9,649 | 30.5% 4,385 | 2.4% 341 |
| 1916 | 46.1% 6,870 | 44.8% 6,683 | 9.2% 1,366 |
| 1912 | 20.9% 1,668 | 42.1% 3,360 | 37.0% 2,947 |
| 1908 | 52.7% 4,092 | 43.6% 3,381 | 3.7% 289 |
| 1904 | 69.3% 4,245 | 23.2% 1,423 | 7.4% 455 |
| 1900 | 56.0% 3,769 | 42.5% 2,859 | 1.5% 100 |
| 1896 | 52.0% 3,373 | 47.0% 3,051 | 1.0% 67 |
| 1892 | 50.0% 3,166 | 50.0% 3,166[a] | |
| 1888 | 56.6% 3,398 | 30.7% 1,841 | 12.7% 763 |
Education
Unified school districts
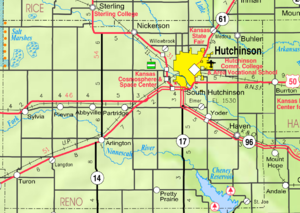
Communities

Cities
- Abbyville
- Arlington
- Buhler
- Haven
- Hutchinson
- Langdon
- Nickerson
- Partridge
- Plevna
- Pretty Prairie
- South Hutchinson
- Sylvia
- Turon
- Willowbrook
References
- Notes
More reading
- History of Reno County, Kansas : Its People, Industries, and Institutions; 2 Volumes; Sheridan Ploughe; Bowen and Company; 445 / 959 pages; 1917. (Volume1 - Download 19MB PDF eBook), (Volume2 - Download 32MB PDF eBook)
- Standard Atlas of Reno County, Kansas; Geo. A. Ogle & Co; 110 pages; 1918.
- Plat Book of Reno County, Kansas; Hutchinson Blue Print Co; 61 pages; 1912.
- Plat Book of Reno County, Kansas; North West Publishing Co; 77 pages; 1902.
Other websites


- County
- Other
- Maps