

元のファイル (SVG ファイル、566 × 425 ピクセル、ファイルサイズ: 80キロバイト)
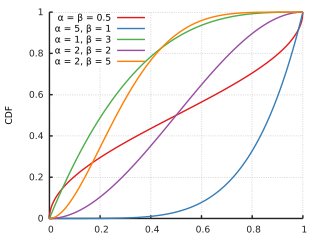
| 解説Beta distribution cdf.svg | English: Cumulative distribution function for the Beta distribution. |
| 日付 | |
| 原典 | 投稿者自身による著作物 |
| 作者 | Horas (トーク) based on the work of Krishnavedala |
| その他のバージョン | File:Beta_distribution_cdf.png |
| Using gnuplot |
|---|
resetreset sessionout=2outputpath= "./"outputfilename="betacummulative"if(out==1) {set terminal qt size 1000,750 font ",14"}if(out==2) {set terminal pdfcairo size 16cm,12cm font ",20" linewidth 2set output outputpath.outputfilename.".pdf"}if(out==3) {set terminal pngcairo size 800,600 font ",14"set output outputpath.outputfilename.".png"}dbeta(x,a,b) = exp((a-1)*log(x)+(b-1)*log(1-x)-lgamma(a)-lgamma(b)+lgamma(a+b))pbeta(x,a,b) = ibeta(a,b,x)f(x,y,z) = pbeta(x,y,z)set samples 500 set xrange [0:1]set xtics 0.2set yrange [0:1]set ytics 0.2#set xlabel "x"set ylabel "CDF"set key at .40,1set grid xtics ytics mytics lw 1 lc rgb "#888888" dashtype 3 lt 1set border 3 back lw 2 lc rgb "#222222"set tics in nomirror scale 0.75lww=2set ls 1 lw lww lc rgb "#e41a1c"set ls 2 lw lww lc rgb "#377eb8"set ls 3 lw lww lc rgb "#4daf4a"set ls 4 lw lww lc rgb "#984ea3"set ls 5 lw lww lc rgb "#ff7f00"plot \ f(x, 0.5,0.5) w l ls 1title "{/Symbol a} = {/Symbol b} = 0.5", \ f(x, 5, 1) w l ls 2title "{/Symbol a} = 5, {/Symbol b} = 1", \ f(x, 1, 3) w l ls 3title "{/Symbol a} = 1, {/Symbol b} = 3", \ f(x, 2, 2) w l ls 4title "{/Symbol a} = 2, {/Symbol b} = 2", \ f(x, 2, 5) w l ls 5title "{/Symbol a} = 2, {/Symbol b} = 5"if (out>1) {set output}if (out == 1) {pause -1} |
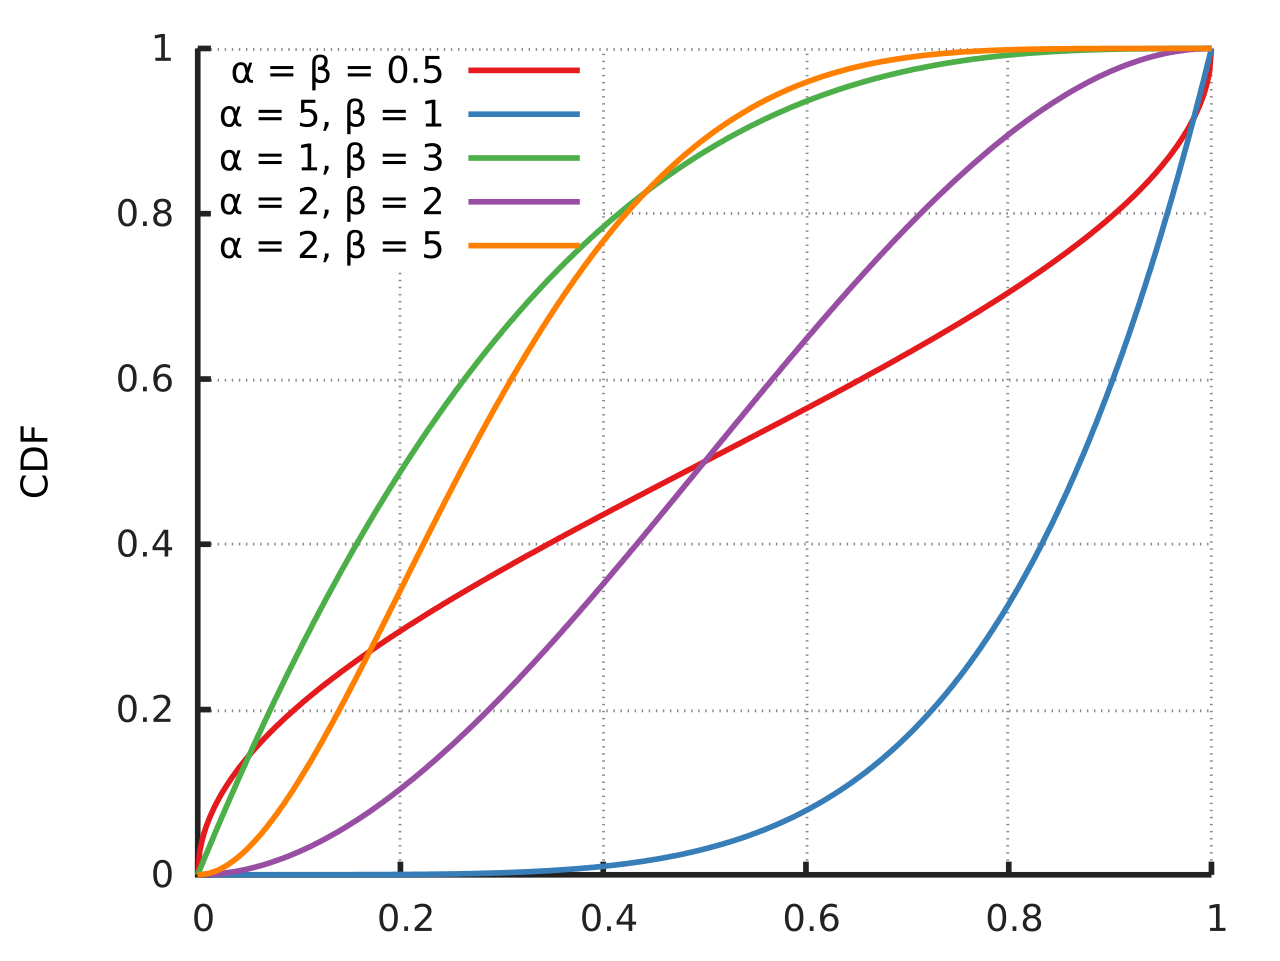
| Using python with matplotlib, scipy and numpy toolboxes. |
|---|
from matplotlib.pyplot import *from numpy import linspacefrom scipy.stats import betax = linspace(0,1,75)fig = figure()ax = fig.add_subplot(111)ax.plot(x,beta.cdf(x,0.5,0.5),label=r"$\alpha=\beta=0.5$")ax.plot(x,beta.cdf(x,5,1),label=r"$\alpha=5, \beta=1$")ax.plot(x,beta.cdf(x,1,3),label=r"$\alpha=1, \beta=3$")ax.plot(x,beta.cdf(x,2,2),label=r"$\alpha=2, \beta=2$")ax.plot(x,beta.cdf(x,2,5),label=r"$\alpha=2, \beta=5$")ax.grid(True)ax.minorticks_on()ax.legend(loc=9)setp(ax.get_legend().get_texts(),fontsize='small')ax.set_ylim(0,2.6)ax.set_xlabel("x")ax.set_ylabel("PDF")fig.savefig("Beta_distribution_cdf.svg",bbox_inches="tight",\pad_inches=.15) |
| Public domainPublic domainfalsefalse |
| この著作物は、完全に常識的な情報から構成され創作性を欠くために、著作権発生の資格がなく、故にパブリックドメインの状態にあります。 |
過去の版のファイルを表示するには、その版の日時をクリックしてください。
| 日付と時刻 | サムネイル | 寸法 | 利用者 | コメント | |
|---|---|---|---|---|---|
| 現在の版 | 2014年11月14日 (金) 18:50 | | 566 × 425 (80キロバイト) | Horas | {{Information |Description=edited to fit to prob. density function plot. Better readability. |Date=2014-11-14 |Source={{own}} |Author= ~~~ |Permission= |other_versions= }} |
| 2011年6月4日 (土) 21:56 |  | 640 × 495 (65キロバイト) | Krishnavedala | corrected the y-axis label and location of legend | |
| 2011年6月4日 (土) 21:54 |  | 639 × 495 (65キロバイト) | Krishnavedala | corrected the range of y-axis | |
| 2011年6月4日 (土) 21:53 |  | 639 × 489 (68キロバイト) | Krishnavedala | {{Information |Description ={{en|1=Cumulative distribution function for the Beta distribution. Created using python with matplotlib, scipy and numpy toolboxes. <syntaxhighligh |
以下のページがこのファイルを使用しています:
以下に挙げる他のウィキがこの画像を使っています:
このファイルには、追加情報があります (おそらく、作成やデジタル化する際に使用したデジタルカメラやスキャナーが追加したものです)。
このファイルが元の状態から変更されている場合、修正されたファイルを完全に反映していない項目がある場合があります。
| 画像の幅 | 453pt |
|---|---|
| 画像の高さ | 340pt |