

Rozmiar pierwotny (824 × 346 pikseli, rozmiar pliku: 15 KB, typ MIME: image/png)
| OpisCorrelation examples.png | See below. |
| Data | 8 grudnia 2007 (data pierwszego przesłania pliku) |
| Źródło | Na Commons przeniósł z en.wikipedia użytkownik jtneill. Ten diagram został stworzony za pomocą Mathematica |
| Autor | Imagecreator z angielskiej Wikipedii |
| Inne wersje | File:CovrarianceCorrelation.svg, File:Correlation examples2.svg |
 | Ta ilustracja ma także [[:Image:CovrarianceCorrelaخنtion.svg|wersję wektorową („SVG”)]]. Zaleca się wykorzystywanie w galeriach dostępnej wersji wektorowej zamiast obecnej. Image does not exist File:Correlation examples.png → [[:File:CovrarianceCorrelaخنtion.svg]] Więcej o grafice wektorowej przeczytasz w artykule Przenoszenie grafik Commons do formatu SVG. Dostępna jest także informacja o obsłudze grafik SVG przez MediaWiki.
| [[File:CovrarianceCorrelaخنtion.svg|Nowa grafika|150x150px]] |
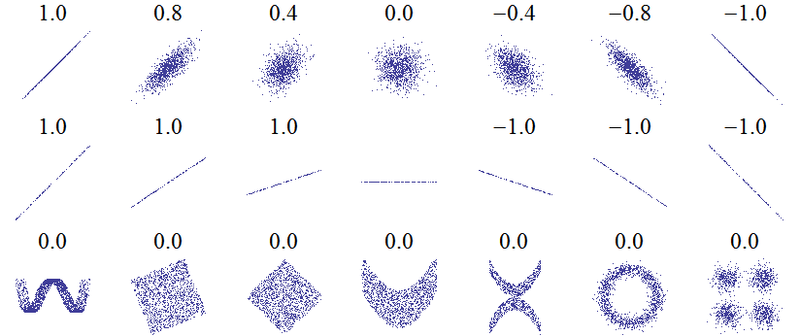
An example of the correlation of x and y for various distributions of (x,y) pairs. It was created by this Mathematica 6 code, which I wrote and release into the public domain (needs makePlot!):
n = 2000;GraphicsArray[{ Table[makePlot[ Table[{RandomReal[NormalDistribution[0, 1]], (1 - Abs[w])* RandomReal[NormalDistribution[0, 1]]} . RotationMatrix[-Sign[w]*Pi/4], {i, -1, 1, 2./n}], 1000], {w, 1, -1, -1/3}], Table[makePlot[Table[{x, slope*x}, {x, -1, 1, 2./n}], 100], {slope, 1, -1, -1/3}], { makePlot[ Table[{x + RandomReal[]/3, 4 (x^2 - 1/2)^2 + RandomReal[]/500} , {x, -1, 1, 2./n}], 2000], makePlot[ Table[{RandomReal[{-1, 1}], RandomReal[{-1, 1}]} . RotationMatrix[-Pi/8], {x, -1, 1, 2./n}], 1400], makePlot[ Table[{RandomReal[{-1, 1}], RandomReal[{-1, 1}]} . RotationMatrix[-Pi/4], {x, -1, 1, 2./n}], 1400], makePlot[Table[{x, x^2 + RandomReal[]}/2, {x, -1, 1, 2./n}], 1400], makePlot[ Table[{x, x^2 + RandomReal[]/2}*(RandomInteger[1]*2 - 1), {x, -1, 1, 2./n}], 1000], makePlot[ Table[{Sin[x*Pi] + RandomReal[NormalDistribution[0, 1/8]], Cos[x*Pi] + RandomReal[NormalDistribution[0, 1/8]]}, {x, -1, 1, 2./n}], 1400], makePlot[ Table[{RandomReal[NormalDistribution[0, 1/3]], RandomReal[ NormalDistribution[0, 1/3]]} + {RandomInteger[1]*2 - 1, RandomInteger[1]*2 - 1}, {x, -1, 1, 2./n}], 1400] } }]| Public domainPublic domainfalsefalse |
| Ten utwór został udostępniony jako własność publiczna przez jego autora, Imagecreator z angielskiej Wikipedii. Dotyczy to całego świata. W niektórych krajach może nie być to prawnie możliwe, jeśli tak, to: Imagecreator zapewnia każdemu prawo do użycia tej pracy w dowolnym celu, bez żadnych ograniczeń, chyba że te ograniczenia są wymagane przez prawo.Public domainPublic domainfalsefalse |
Kliknij na datę/czas, aby zobaczyć, jak plik wyglądał w tym czasie.
| Data i czas | Miniatura | Wymiary | Użytkownik | Opis | |
|---|---|---|---|---|---|
| aktualny | 11:33, 2 lut 2010 | | 824 × 346 (15 KB) | JBW | Removing "0.0" for correlation coefficient from horizontal line: here corr. coeff. is undefined. |
| 12:27, 18 mar 2008 |  | 824 × 346 (20 KB) | Jtneill | {{Information |Description={{en|An example of the correlation of x and y for various distributions of (x,y) pairs. It was created by this Mathematica 6 code, which I wrote and release into the public domain: n = 2000; GraphicsArray[{ Table[makePlot[ |
Następujące strony korzystają z tego pliku:
Ten plik jest wykorzystywany także w innych projektach wiki:
