

Original file (SVG file, nominally 2,100 × 2,100 pixels, file size: 171 KB)
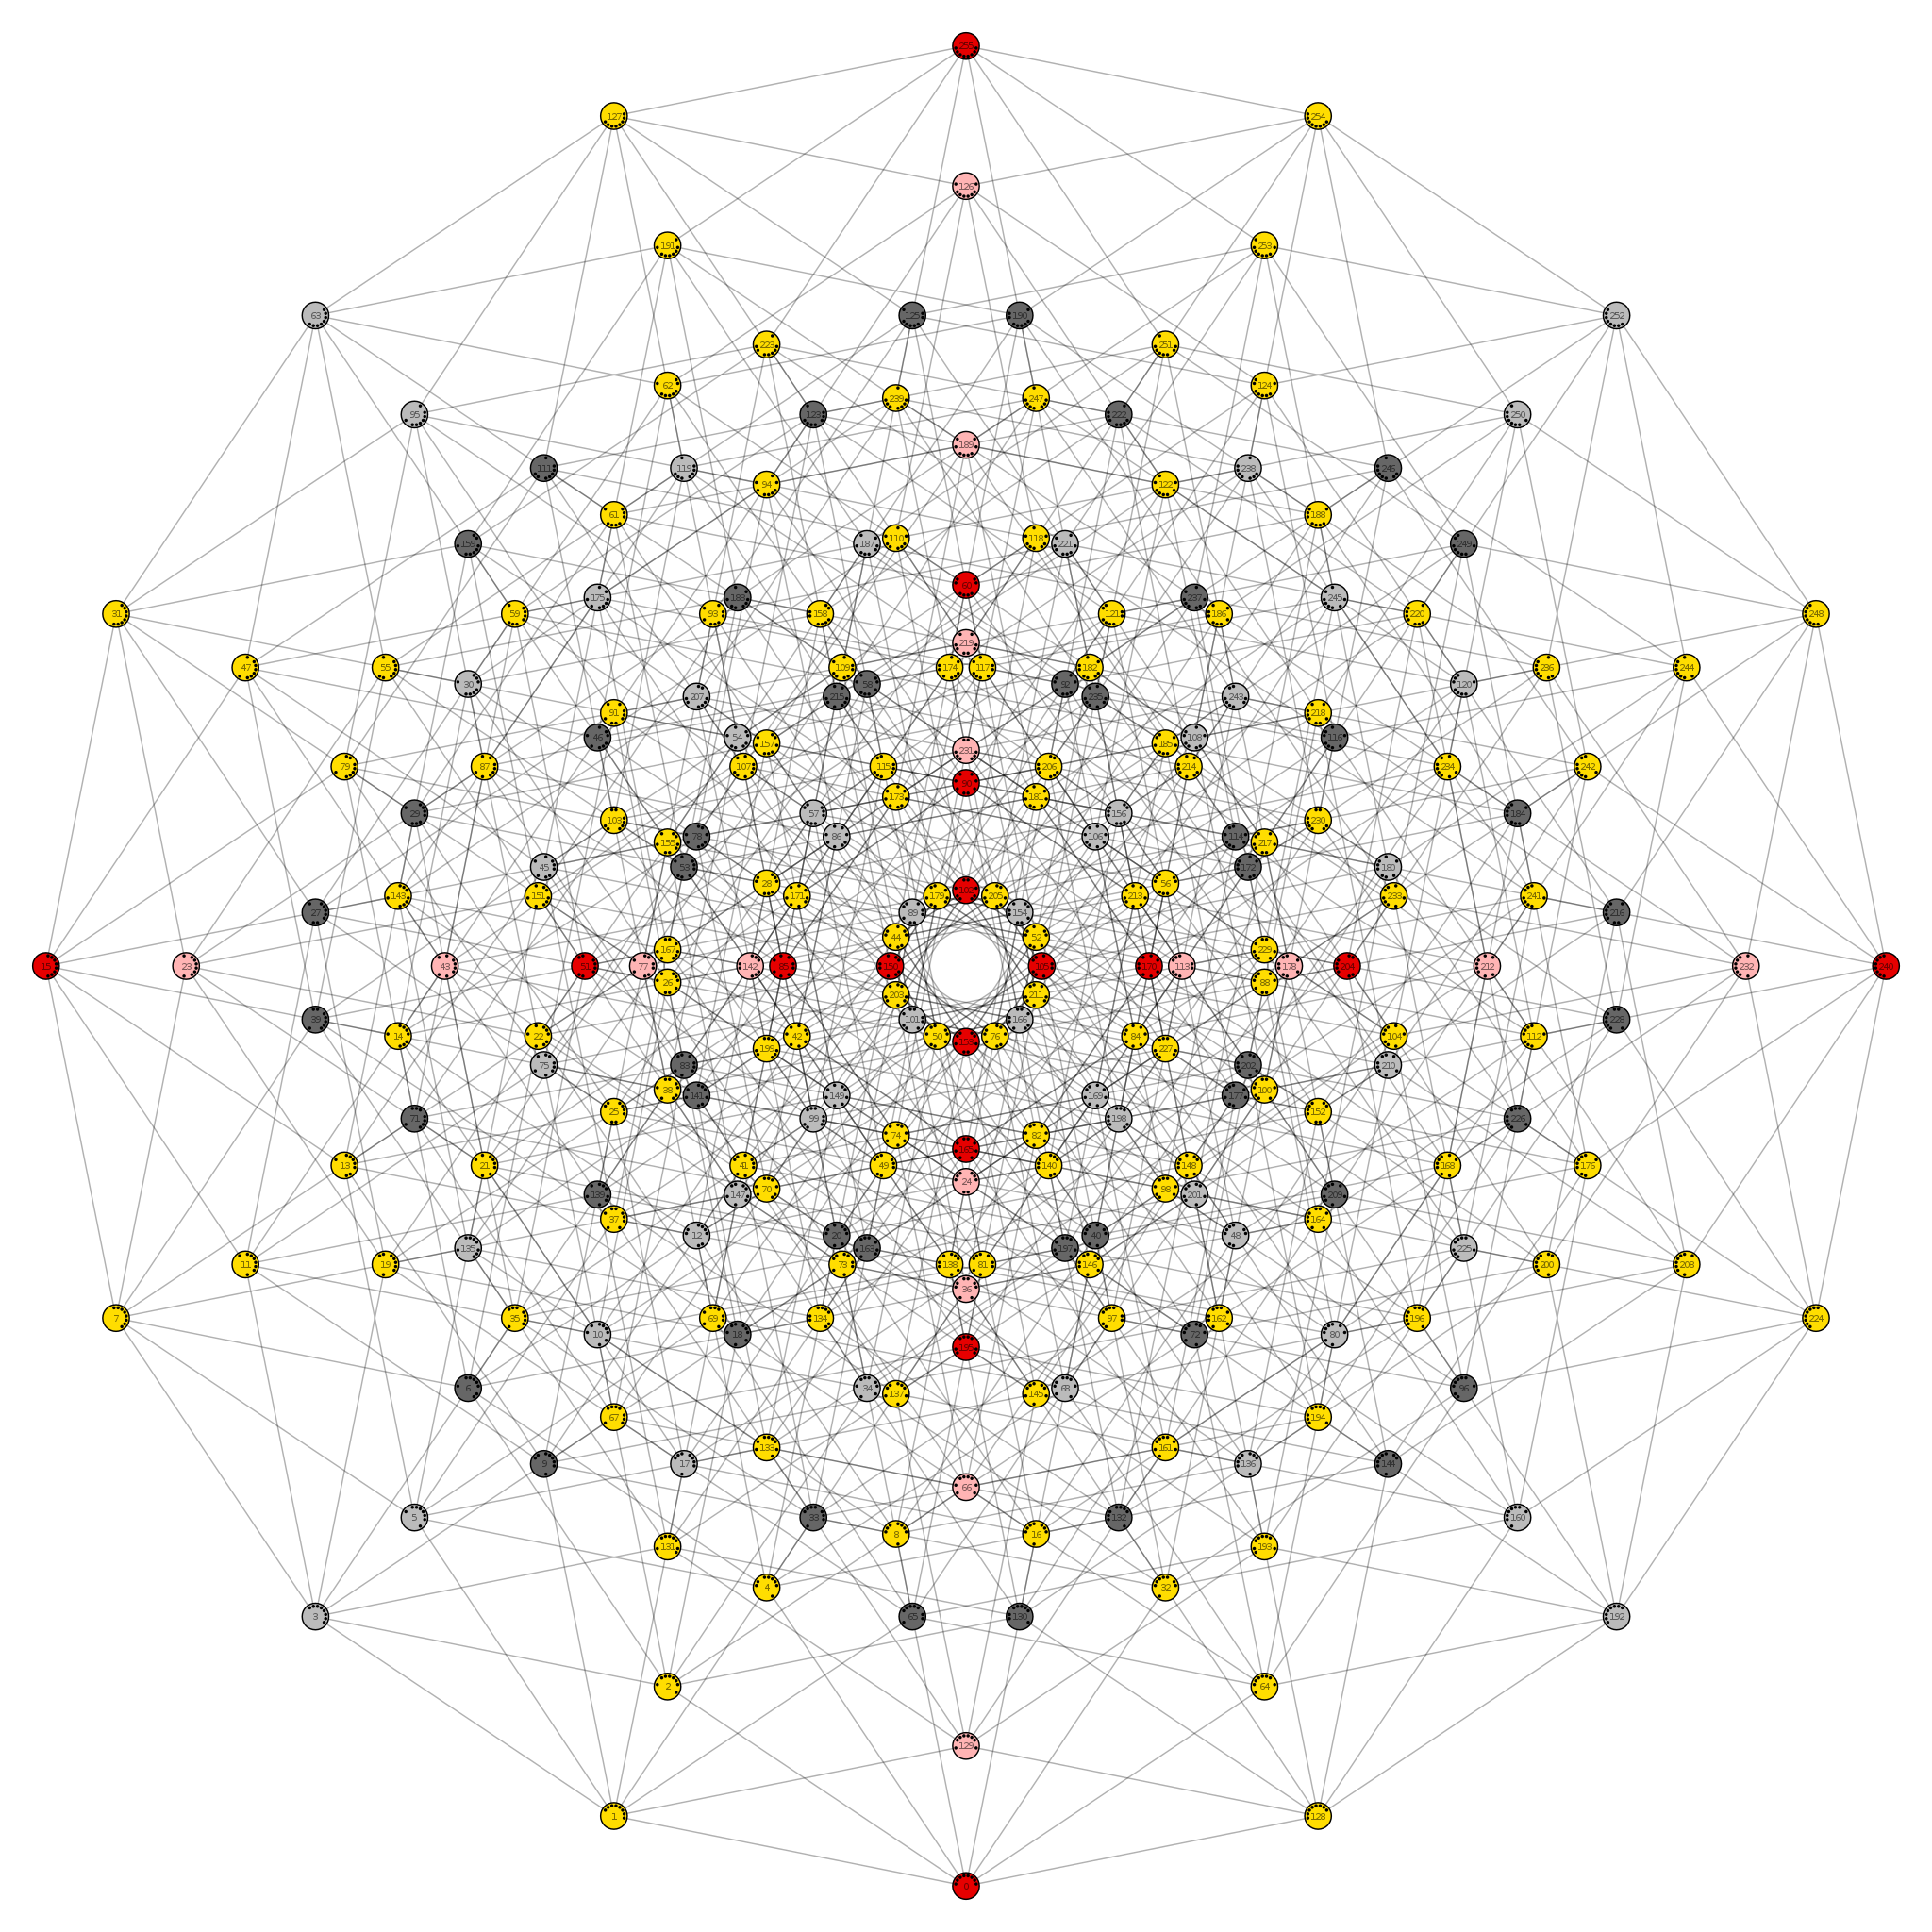
| DescriptionOcteract Petrie polygon.svg |  Petrie polygon graph of the 8-dimensional cube, the Hasse diagram of an 8 element set's power set Compare the Petrie polygon graph of the 4-dimensional cube: The colors represent the Walsh equivalence classes of 3-ary Boolean functions. Simpler Python code is shown in this file. It makes use of code created with the Python code below. | ||
| Source | Own work | ||
| Author |
| ||
| Other versions |  |
This image has been assessed using the Quality image guidelines and is considered a Quality image. العربية ∙ جازايرية ∙ беларуская ∙ беларуская (тарашкевіца) ∙ български ∙ বাংলা ∙ català ∙ čeština ∙ Cymraeg ∙ Deutsch ∙ Schweizer Hochdeutsch ∙ Zazaki ∙ Ελληνικά ∙ English ∙ Esperanto ∙ español ∙ eesti ∙ euskara ∙ فارسی ∙ suomi ∙ français ∙ galego ∙ עברית ∙ हिन्दी ∙ hrvatski ∙ magyar ∙ հայերեն ∙ Bahasa Indonesia ∙ italiano ∙ 日本語 ∙ Jawa ∙ ქართული ∙ 한국어 ∙ kurdî ∙ Lëtzebuergesch ∙ lietuvių ∙ македонски ∙ മലയാളം ∙ मराठी ∙ Bahasa Melayu ∙ Nederlands ∙ Norfuk / Pitkern ∙ polski ∙ português ∙ português do Brasil ∙ rumantsch ∙ română ∙ русский ∙ sicilianu ∙ slovenčina ∙ slovenščina ∙ shqip ∙ српски / srpski ∙ svenska ∙ தமிழ் ∙ తెలుగు ∙ ไทย ∙ Tagalog ∙ Türkçe ∙ toki pona ∙ українська ∙ vèneto ∙ Tiếng Việt ∙ 中文 ∙ 中文(简体) ∙ 中文(繁體) ∙ +/− |
| Python and SVG source |
|---|
from sympy import cos, pifrom math import logfrom my.own.stuff import number_to_reverse_binary_list, hypercube_edgesimport psycopg2con = psycopg2.connect(host='lukulhuft', database='hupu', user='tupu', password='lupu')cur = con.cursor()bg_colors = ['fd0', 'e60000', 'bbb', '666', 'ffb4b4']angle = pi / 16a = cos(angle)b = cos(3*angle)c = cos(5*angle)d = cos(7*angle)directions = [ [-a, d], [-b, c], [-c, b], [-d, a], [d, a], [c, b], [b, c], [a, d]] # directions of the 8 edges leaving the lowest vertex (as sympy objects)big_factor = 1000 / (a + b + c + d) # diameter of the whole diagram shall be 2000tiny_factor = 0.029 # the tiny dots in the vertices must be slightly off center################################## vertices ##################################sym_coordinates = [] # sympy objectssvg_coordinates = [] # rounded and converted to stringssvg_vertices = ''svg_numbers = ''for i in range(256): cur.execute("""select wec from boolf3 where numval = %s""" % (i)) bg_color_index = cur.fetchone()[0] + 1 # from the DB comes a value between -1 and 3 bg_color = bg_colors[bg_color_index] binary_vector = number_to_reverse_binary_list(i, 8) x_sym = 0 y_sym = 0 for j in range(8): if binary_vector[j]: x_sym += directions[j][0] y_sym += directions[j][1] x_svg = str(round(big_factor * x_sym, 3)) y_svg = str(round(-big_factor * y_sym + 1000, 3)) sym_coordinates.append({'x': x_sym, 'y': y_sym}) svg_coordinates.append({'x': x_svg, 'y': y_svg}) svg_vertices += '<circle cx="%s" cy="%s" r="14.5" fill="#%s"/>' % (x_svg, y_svg, bg_color) svg_numbers += '<text x="%s" y="%s">%s</text>' % (x_svg, y_svg, i)################################## edges ##################################svg_edges = ''svg_tiny_dots = ''edges = hypercube_edges(8)for edge in edges: # ``edge`` is a pair of integers between 0 and 255 bottom = edge[0] top = edge[1] bottom_x_svg = svg_coordinates[bottom]['x'] bottom_y_svg = svg_coordinates[bottom]['y'] top_x_svg = svg_coordinates[top]['x'] top_y_svg = svg_coordinates[top]['y'] svg_edges += '<line x1="%s" y1="%s" x2="%s" y2="%s"/>' % (bottom_x_svg, bottom_y_svg, top_x_svg, top_y_svg) edge_direction = directions[int(log(bottom ^ top, 2))] tiny_edge_direction_x = tiny_factor * edge_direction[0] tiny_edge_direction_y = tiny_factor * edge_direction[1] bottom_x_sym = sym_coordinates[bottom]['x'] bottom_y_sym = sym_coordinates[bottom]['y'] top_x_sym = sym_coordinates[top]['x'] top_y_sym = sym_coordinates[top]['y'] bottom_tiny_x_sym = bottom_x_sym + tiny_edge_direction_x bottom_tiny_y_sym = bottom_y_sym + tiny_edge_direction_y top_tiny_x_sym = top_x_sym - tiny_edge_direction_x top_tiny_y_sym = top_y_sym - tiny_edge_direction_y bottom_tiny_x_svg = str(round(big_factor * bottom_tiny_x_sym, 3)) bottom_tiny_y_svg = str(round(-big_factor * bottom_tiny_y_sym + 1000, 3)) top_tiny_x_svg = str(round(big_factor * top_tiny_x_sym, 3)) top_tiny_y_svg = str(round(-big_factor * top_tiny_y_sym + 1000, 3)) svg_tiny_dots += '<circle cx="%s" cy="%s" r="1.8"/><circle cx="%s" cy="%s" r="1.8"/> ' % \ (bottom_tiny_x_svg, bottom_tiny_y_svg, top_tiny_x_svg, top_tiny_y_svg)################################## file ##################################svg_string = """<?xml version="1.0" encoding="UTF-8"?><svg xmlns="http://www.w3.org/2000/svg" width="2100" height="2100" viewBox="-1050 -1050 2100 2100"> <!-- edges --> <g style="stroke:#000; stroke-width:1.5; stroke-opacity:0.5;"> %s </g> <!-- vertices --> <g style="stroke:#000; stroke-width:1.5px;"> %s </g> <!-- tiny dots --> %s <!-- numbers --> <g style="text-anchor: middle; letter-spacing: -1;" font-size="10px" font-family="sans-serif" transform="translate(0, 3.7)" fill-opacity="0.5"> %s </g></svg>""" % (svg_edges, svg_vertices, svg_tiny_dots, svg_numbers)svg_file = open('Octeract Petrie polygon.svg', 'w')svg_file.write(svg_string) |
 | Permission is granted to copy, distribute and/or modify this document under the terms of the GNU Free Documentation License, Version 1.2 or any later version published by the Free Software Foundation; with no Invariant Sections, no Front-Cover Texts, and no Back-Cover Texts. A copy of the license is included in the section entitled GNU Free Documentation License.http://www.gnu.org/copyleft/fdl.htmlGFDLGNU Free Documentation Licensetruetrue |
Click on a date/time to view the file as it appeared at that time.
| Date/Time | Thumbnail | Dimensions | User | Comment | |
|---|---|---|---|---|---|
| current | 20:21, 22 June 2016 | | 2,100 × 2,100 (171 KB) | Watchduck | pointlessly tiny change |
| 19:07, 22 June 2016 |  | 2,100 × 2,100 (171 KB) | Watchduck | clean code, colors for equivalence classes | |
| 23:58, 2 October 2009 |  | 1,375 × 1,375 (1,022 KB) | Watchduck | ||
| 18:15, 2 October 2009 |  | 1,488 × 1,488 (1,022 KB) | Watchduck | {{Information |Description={{en|1=Symmetrical central graph of the 8 dimensional cube (Octeract) and Hasse diagram of an 8 element sets power set. (Compare: [[:Image:Hypercubestar.svg|Central gr |
The following other wikis use this file:
This file contains additional information, probably added from the digital camera or scanner used to create or digitize it.
If the file has been modified from its original state, some details may not fully reflect the modified file.
| Width | 2100 |
|---|---|
| Height | 2100 |
