
Today's featured picture
About

Toolbox
 Climate | |
|---|---|
| The core of the human eye can read | |
 Edit | - |
 Graphs | |
 Wikipedia |
Graphs
I love it how Aboriginal paintings depict a whole story.
Good graphs can also tell a story, as Edward Tufte describes in his books on data visualization.
Global warming
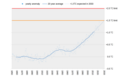
 Daily Sea Surface Temperatures 60S-60N 1979-2023

This Copernicus graph is a jewel. It is a graph that tells a whole story in an instant.
The blue, white, red lines are like waves of an ocean. The colours seem to show increasing temperature, yet actually show time, decades of data. Time and temperature coincide.
2023 jumps out of the waves, is out of bandwidth. Oceans are warming.
Climate change graphs
 A Péguy climograph shows average temperature and precipitation of a climate per month.
 Change of climate and its impact, with red for impossible agriculture.
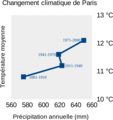 120 years of climate change in Paris.
 Climate change in Paris 1881-2000.
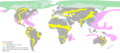 Impact


Climate tipping point +1.5 °C
 The 20 year average is expected to cross +1.5 °C in 2033.
 In 2000 the tipping point was expected in 2045. In 2023 the expectation was 2033.

Polls
10
20
30
40
50
PVV
GL–PvdA
VVD
NSC
D66
BBB
CDA
SP
PvdD
FvD
CU
DENK
SGP
Volt
JA21
This chart tells the story of an election or poll. What are the changes since the previous election?
- new party.
- party that gained seats.
- party maintained seats, did not win, did not lose.
- Party lost seats. The top of is the result in the previous election.
- party lost all seats.
:( Graph module down
right aligned graph
🔥 Top keywords: Main PageSpecial:SearchPage 3Wikipedia:Featured picturesHouse of the DragonUEFA Euro 2024Bryson DeChambeauJuneteenthInside Out 2Eid al-AdhaCleopatraDeaths in 2024Merrily We Roll Along (musical)Jonathan GroffJude Bellingham.xxx77th Tony AwardsBridgertonGary PlauchéKylian MbappéDaniel RadcliffeUEFA European Championship2024 ICC Men's T20 World CupUnit 731The Boys (TV series)Rory McIlroyN'Golo KantéUEFA Euro 2020YouTubeRomelu LukakuOpinion polling for the 2024 United Kingdom general electionThe Boys season 4Romania national football teamNicola CoughlanStereophonic (play)Gene WilderErin DarkeAntoine GriezmannProject 2025