Sutton and Cheam is a constituency[n 1] in Greater London represented in the House of Commons of the UK Parliament since 2015 by Paul Scully, a Conservative.[n 2]
| Sutton and Cheam | |
|---|---|
| Borough constituency for the House of Commons | |
 Boundary of Sutton and Cheam in Greater London | |
| County | Greater London |
| Electorate | 71,284 (2023)[1] |
| Current constituency | |
| Created | 1945 |
| Member of Parliament | TBC (TBC) |
| Created from | Mid Surrey or more commonly 'Epsom' (as eastern offshoot seat) |
Political history
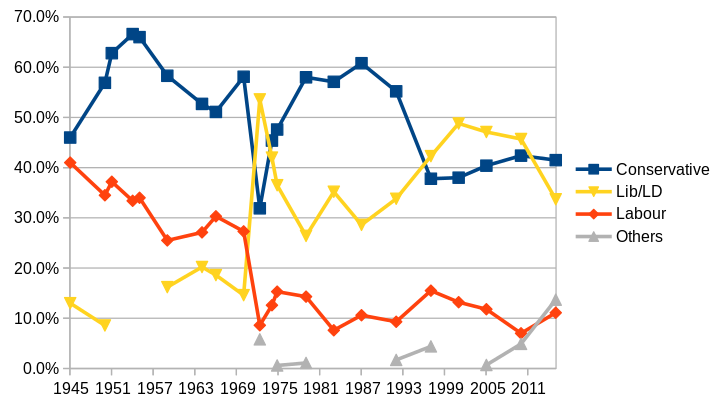
The area's voters produced a 32.6% swing to the Liberal Party in the 1972 by-election.[2] In the nine prior elections it only returned Conservative MPs and the Liberal candidate polled third behind Labour six times and none stood three times.
The seat is a marginal seat which has since 1970 frequently flipped between electing Conservative and Liberal/Liberal Democrat candidates. During the Conservative Government 1979–1990, the seat was won by a sufficient majority to be branded a Conservative safe seat. It was regained by the Liberal Democrats in the 1997 general election and subsequently held in the 2001, 2005 and 2010 general elections. In the 2015 general election the seat was regained by the Conservatives. In June 2016, an estimated 51.28% of local adults voting in the EU membership referendum chose to leave the European Union instead of to remain.[3] This was matched in two January 2018 votes in Parliament by its MP.[4]
At the 2017 general election, the incumbent Conservative MP, Paul Scully, gained an 8.3% swing which moved the seat away from the typical "marginal" band of analysis: Scully won by a 24.4% majority. Due to the secret ballot only opinion polls can determine if this rise in popularity had more to do with the campaign of the Liberal Democrat candidate and/or the Conservatives picking up votes from the non-standing party UKIP, whose withdrawal was common in 2017 nationwide, following the vote to leave the EU. UKIP had 378 candidates across the UK, 346 fewer than in 2015.[5] Also not standing, and having lost their deposits in 2015, were two left-wing minor candidates. An 11.6% extra vote share was on hand for four parties as the candidate list fell from seven to four.
The seat had ranked from 2015 to 2017 the 39th-slimmest margin of majority, specifically in share of the vote as opposed to number of votes, among the 331 Conservative seats.[6] Labour achieved their highest in Sutton and Cheam since 1970 but still finished third; a swing of several percentage points would have been required to make Labour the closest challengers to the Conservatives. The Conservatives finished in fourth place in the European Election 2019, trailing significantly behind the Liberal Democrats, the Brexit Party, and the Labour Party.[7]
Prominent members
Richard Sharples, the constituency's Conservative MP from 1954, was a former major in the army, and served as a Home Office Minister, before resigning his seat in 1972 to become Governor of Bermuda.
Boundaries

Historic

1945–1950: The Municipal Borough of Sutton and Cheam.
1950–1964: as above (from 1965 becoming wards of the London Borough of Sutton but not described as such in boundary legislation itself for a time).
1964–1978: The London Borough of Sutton wards of Belmont, Cheam North, Cheam South, Cheam West, Sutton Central, Sutton East, Sutton North, Sutton North East, Sutton South, Sutton South East, Worcester Park North, and Worcester Park South.
1978–2002: The London Borough of Sutton wards of Belmont, Cheam South, Cheam West, North Cheam, Rosehill, Sutton Central, Sutton Common, Sutton East, Sutton South, Sutton West, Worcester Park North, and Worcester Park South.
2002–2024: The London Borough of Sutton wards of Belmont, Cheam, Nonsuch, Stonecot, Sutton Central, Sutton North, Sutton South, Sutton West, and Worcester Park.
Current
Further to the 2023 Periodic Review of Westminster constituencies, which came into effect for the 2024 general election, the boundaries of the constituency are virtually unchanged. However, following a review of local authority ward boundaries which came into effect on 4 May 2022, the composition of the seat is now composed of the following London Borough of Sutton wards:
- Belmont, Cheam, North Cheam, Stonecot, Sutton Central, Sutton North, Sutton South, Sutton West & East Cheam, Worcester Park North, and Worcester Park South.[8]
Constituency profile
The area maintains separate schooling systems, with grammar schools and comprehensive schools, similar to Kingston upon Thames; it has more semi-detached, terraced and detached properties than the Greater London average.[9]
Workless claimants, registered jobseekers, were in November 2012 significantly lower than the national average of 3.8%, at 2.1% of the population based on a statistical compilation by The Guardian.[10]
Members of Parliament
Elections
 Results of UK House of Commons seat Sutton and Cheam, created in 1945

Elections in the 2020s
| Party | Candidate | Votes | % | ±% | |
|---|---|---|---|---|---|
| Liberal Democrats | Luke Taylor | 17,576 | 36.9 | +3.5 | |
| Conservative | Tom Drummond | 13,775 | 28.9 | -21.1 | |
| Labour | Chrishni Reshekaron | 8,430 | 17.7 | +3.4 | |
| Reform UK | Ryan Powell | 5,787 | 12.2 | +12.2 | |
| Green | Aasha Anam | 1,721 | 3.6 | +1.3 | |
| Independent | Hamilton Action-Man Kingsley | 317 | 0.7 | +0.7 | |
| Majority | |||||
| Turnout | |||||
Elections in the 2010s
| Party | Candidate | Votes | % | ±% | |
|---|---|---|---|---|---|
| Conservative | Paul Scully | 25,235 | 50.0 | -1.1 | |
| Liberal Democrats | Hina Bokhari | 16,884 | 33.4 | +6.7 | |
| Labour | Bonnie Craven | 7,200 | 14.3 | -6.2 | |
| Green | Claire Jackson-Prior | 1,168 | 2.3 | +0.6 | |
| Majority | 8,351 | 16.6 | -7.8 | ||
| Turnout | 50,487 | 70.4 | -3.4 | ||
| Registered electors | 71,760 | ||||
| Conservative hold | Swing | -3.9 | |||
| Party | Candidate | Votes | % | ±% | |
|---|---|---|---|---|---|
| Conservative | Paul Scully | 26,567 | 51.1 | +9.6 | |
| Liberal Democrats | Amna Ahmad | 13,869 | 26.7 | -7.0 | |
| Labour | Bonnie Craven | 10,663 | 20.5 | +9.4 | |
| Green | Claire Jackson-Prior | 871 | 1.7 | -0.4 | |
| Majority | 12,698 | 24.4 | +16.6 | ||
| Turnout | 51,970 | 73.8 | +1.7 | ||
| Registered electors | 70,404 | ||||
| Conservative hold | Swing | +8.3 | |||
| Party | Candidate | Votes | % | ±% | |
|---|---|---|---|---|---|
| Conservative | Paul Scully | 20,732 | 41.5 | -0.8 | |
| Liberal Democrats | Paul Burstow | 16,811 | 33.7 | -12.0 | |
| Labour | Emily Brothers | 5,546 | 11.1 | +4.1 | |
| UKIP | Angus Dalgleish | 5,341 | 10.7 | +8.7 | |
| Green | Maeve Tomlinson | 1,051 | 2.1 | +1.6 | |
| NHA | Dave Ash | 345 | 0.7 | New | |
| TUSC | Pauline Gorman | 79 | 0.2 | New | |
| Majority | 3,921 | 7.8 | N/A | ||
| Turnout | 49,905 | 72.1 | -0.7 | ||
| Registered electors | 69,228 | ||||
| Conservative gain from Liberal Democrats | Swing | +5.6 | |||
| Party | Candidate | Votes | % | ±% | |
|---|---|---|---|---|---|
| Liberal Democrats | Paul Burstow | 22,156 | 45.7 | −1.2 | |
| Conservative | Philippa Stroud | 20,548 | 42.4 | +1.7 | |
| Labour | Kathy Allen | 3,376 | 7.0 | −4.9 | |
| BNP | John Clarke | 1,014 | 2.1 | New | |
| UKIP | David Pickles | 950 | 2.0 | New | |
| Green | Peter Hickson | 246 | 0.5 | New | |
| English Democrat | John Dodds | 106 | 0.2 | New | |
| CPA | Matthew Connolly | 52 | 0.1 | New | |
| Libertarian | Martin Cullip | 41 | 0.1 | New | |
| Independents Federation UK | Brian Hammond | 19 | 0.0 | New | |
| Majority | 1,608 | 3.3 | −2.9 | ||
| Turnout | 48,508 | 72.8 | +5.5 | ||
| Registered electors | 66,658 | ||||
| Liberal Democrats hold | Swing | −1.5 | |||
Elections in the 2000s
| Party | Candidate | Votes | % | ±% | |
|---|---|---|---|---|---|
| Liberal Democrats | Paul Burstow | 19,768 | 47.1 | -1.7 | |
| Conservative | Richard Willis | 16,922 | 40.4 | +2.4 | |
| Labour | Anand Shukla | 4,954 | 11.8 | -1.4 | |
| Rainbow Dream Ticket | Rainbow George Weiss | 288 | 0.7 | New | |
| Majority | 2,846 | 6.7 | -4.1 | ||
| Turnout | 41,932 | 66.2 | +3.8 | ||
| Registered electors | 62,885 | ||||
| Liberal Democrats hold | Swing | -2.0 | |||
| Party | Candidate | Votes | % | ±% | |
|---|---|---|---|---|---|
| Liberal Democrats | Paul Burstow | 19,382 | 48.8 | +6.5 | |
| Conservative | Olga Maitland | 15,078 | 38.0 | +0.2 | |
| Labour | Lisa Homan | 5,263 | 13.2 | -2.3 | |
| Majority | 4,304 | 10.8 | +6.4 | ||
| Turnout | 39,723 | 62.4 | -12.5 | ||
| Registered electors | 63,648 | ||||
| Liberal Democrats hold | Swing | +3.2 | |||
Elections in the 1990s
| Party | Candidate | Votes | % | ±% | |
|---|---|---|---|---|---|
| Liberal Democrats | Paul Burstow | 19,919 | 42.3 | +8.5 | |
| Conservative | Olga Maitland | 17,822 | 37.9 | -17.3 | |
| Labour | Mark Allison | 7,280 | 15.5 | +5.6 | |
| Referendum | Peter Atkinson | 1,784 | 3.8 | New | |
| UKIP | Simon Mckie | 191 | 0.4 | New | |
| Natural Law | Deborah Wright | 96 | 0.2 | -0.1 | |
| Majority | 2,097 | 4.4 | N/A | ||
| Turnout | 47,092 | 74.9 | -7.5 | ||
| Registered electors | 62,824 | ||||
| Liberal Democrats gain from Conservative | Swing | -12.9 | |||
| Party | Candidate | Votes | % | ±% | |
|---|---|---|---|---|---|
| Conservative | Olga Maitland | 27,710 | 55.2 | -5.6 | |
| Liberal Democrats | Paul Burstow | 16,954 | 33.8 | +5.2 | |
| Labour | G. C. Martin | 4,980 | 9.9 | -0.7 | |
| Green | J. Duffy | 444 | 0.9 | New | |
| Natural Law | A. Hatchard | 133 | 0.3 | New | |
| Majority | 10,756 | 21.4 | -10.8 | ||
| Turnout | 50,221 | 82.4 | +5.8 | ||
| Registered electors | 60,949 | ||||
| Conservative hold | Swing | -5.4 | |||
Elections in the 1980s
| Party | Candidate | Votes | % | ±% | |
|---|---|---|---|---|---|
| Conservative | Neil Macfarlane | 29,710 | 60.8 | +3.7 | |
| Liberal | Robert Greig | 13,992 | 28.6 | -6.6 | |
| Labour | Loraine Monk | 5,202 | 10.6 | +3.0 | |
| Majority | 15,718 | 32.2 | +10.3 | ||
| Turnout | 48,904 | 76.6 | +2.3 | ||
| Registered electors | 63,850 | ||||
| Conservative hold | Swing | +5.1 | |||
| Party | Candidate | Votes | % | ±% | |
|---|---|---|---|---|---|
| Conservative | Neil Macfarlane | 26,782 | 57.1 | -0.9 | |
| Liberal | Christopher Caswill | 16,518 | 35.2 | +8.8 | |
| Labour | Geoffrey Dixon | 3,568 | 7.6 | -6.7 | |
| Majority | 10,264 | 21.9 | -9.7 | ||
| Turnout | 46,868 | 74.3 | -4.5 | ||
| Registered electors | 63,099 | ||||
| Conservative hold | Swing | -4.0 | |||
Elections in the 1970s
| Party | Candidate | Votes | % | ±% | |
|---|---|---|---|---|---|
| Conservative | Neil Macfarlane | 28,842 | 58.0 | +10.4 | |
| Liberal | Christopher Caswill | 13,136 | 26.4 | -10.1 | |
| Labour | Nancy Irwin[27] | 7,126 | 14.3 | -1.0 | |
| National Front | John Hunt[27] | 465 | 0.9 | New | |
| Independent | John Smoker[27] | 128 | 0.2 | New | |
| Majority | 15,706 | 31.6 | +20.5 | ||
| Turnout | 49,277 | 78.8 | +1.9 | ||
| Registered electors | 63,038 | ||||
| Conservative hold | Swing | ||||
| Party | Candidate | Votes | % | ±% | |
|---|---|---|---|---|---|
| Conservative | Neil Macfarlane | 22,156 | 47.6 | +2.2 | |
| Liberal | Graham Tope | 16,995 | 36.5 | -5.5 | |
| Labour | James Kenneth Rhodes | 7,118 | 15.3 | +2.7 | |
| Women's Rights | Una Kroll | 298 | 0.6 | New | |
| Majority | 5,161 | 11.1 | +7.7 | ||
| Turnout | 46,567 | 76.9 | -5.7 | ||
| Registered electors | 60,559 | ||||
| Conservative hold | Swing | ||||
| Party | Candidate | Votes | % | ±% | |
|---|---|---|---|---|---|
| Conservative | Neil Macfarlane | 22,555 | 45.4 | -12.7 | |
| Liberal | Graham Tope | 20,836 | 42.0 | +27.4 | |
| Labour | James Kenneth Rhodes | 6,270 | 12.6 | -14.7 | |
| Majority | 1,719 | 3.4 | N/A | ||
| Turnout | 49,661 | 82.6 | +15.0 | ||
| Registered electors | 60,109 | ||||
| Conservative hold | Swing | ||||
| Party | Candidate | Votes | % | ±% | |
|---|---|---|---|---|---|
| Liberal | Graham Tope | 18,328 | 53.6 | +39.0 | |
| Conservative | Neil Macfarlane | 10,911 | 31.9 | -26.2 | |
| Labour | David Miller | 2,937 | 8.6 | -18.7 | |
| Anti-Common Market | Chris Frere-Smith | 1,332 | 3.9 | New | |
| National Independence | Edgar Scruby | 660 | 1.9 | New | |
| Majority | 7,417 | 21.7 | N/A | ||
| Turnout | 34,194 | 56.3 | -11.3 | ||
| Registered electors | |||||
| Liberal gain from Conservative | Swing | +32.6 | |||
| Party | Candidate | Votes | % | ±% | |
|---|---|---|---|---|---|
| Conservative | Richard Sharples | 23,957 | 58.1 | +7.00 | |
| Labour | John Dowsett | 11,261 | 27.3 | -2.99 | |
| Liberal | Nicholas DM McGeorge | 6,023 | 14.6 | -4.01 | |
| Majority | 12,696 | 30.8 | +9.99 | ||
| Turnout | 41,241 | 67.6 | -8.76 | ||
| Registered electors | 61,050 | ||||
| Conservative hold | Swing | ||||
Elections in the 1960s
| Party | Candidate | Votes | % | ±% | |
|---|---|---|---|---|---|
| Conservative | Richard Sharples | 22,331 | 51.10 | -1.55 | |
| Labour | Frank J Ward | 13,235 | 30.29 | +3.16 | |
| Liberal | Nicholas DM McGeorge | 8,134 | 18.61 | -1.62 | |
| Majority | 9,096 | 20.81 | -4.71 | ||
| Turnout | 43,700 | 76.36 | +2.09 | ||
| Registered electors | 57,227 | ||||
| Conservative hold | Swing | ||||
| Party | Candidate | Votes | % | ±% | |
|---|---|---|---|---|---|
| Conservative | Richard Sharples | 22,975 | 52.65 | -5.67 | |
| Labour | Paul Derrick | 11,839 | 27.13 | +1.65 | |
| Liberal | John Montgomerie | 8,827 | 20.23 | +4.02 | |
| Majority | 11,136 | 25.52 | -7.32 | ||
| Turnout | 43,641 | 74.27 | -5.34 | ||
| Registered electors | 58,898 | ||||
| Conservative hold | Swing | ||||
Elections in the 1950s
| Party | Candidate | Votes | % | ±% | |
|---|---|---|---|---|---|
| Conservative | Richard Sharples | 27,344 | 58.32 | -7.70 | |
| Labour | Frank Judd | 11,946 | 25.48 | -8.50 | |
| Liberal | John Montgomerie | 7,600 | 16.21 | New | |
| Majority | 15,398 | 32.84 | +0.81 | ||
| Turnout | 46,890 | 79.61 | +3.16 | ||
| Registered electors | 58,763 | ||||
| Conservative hold | Swing | ||||
| Party | Candidate | Votes | % | ±% | |
|---|---|---|---|---|---|
| Conservative | Richard Sharples | 29,538 | 66.02 | +3.25 | |
| Labour | Ronald M Lewis | 15,205 | 33.98 | -3.25 | |
| Majority | 14,333 | 32.04 | +6.51 | ||
| Turnout | 44,743 | 76.45 | -5.23 | ||
| Registered electors | 58,529 | ||||
| Conservative hold | Swing | ||||
| Party | Candidate | Votes | % | ±% | |
|---|---|---|---|---|---|
| Conservative | Richard Sharples | 21,930 | 66.55 | +3.78 | |
| Labour | N. T. Poulter | 11,023 | 33.45 | -3.78 | |
| Majority | 10,907 | 33.10 | +7.57 | ||
| Turnout | 32,953 | 55.60 | -26.08 | ||
| Registered electors | 59,292 | ||||
| Conservative hold | Swing | ||||
| Party | Candidate | Votes | % | ±% | |
|---|---|---|---|---|---|
| Conservative | Sidney Marshall | 30,684 | 62.77 | +5.84 | |
| Labour | Eric KI Hurst | 18,202 | 37.23 | +2.71 | |
| Majority | 12,482 | 25.54 | +3.13 | ||
| Turnout | 58,886 | 81.68 | -5.05 | ||
| Registered electors | 59,848 | ||||
| Conservative hold | Swing | ||||
| Party | Candidate | Votes | % | ±% | |
|---|---|---|---|---|---|
| Conservative | Sidney Marshall | 29,200 | 56.93 | +10.89 | |
| Labour | Helen O. Judd | 17,706 | 34.52 | -6.45 | |
| Liberal | Henry Joseph Wheeler | 4,389 | 8.56 | -4.45 | |
| Majority | 11,494 | 22.41 | +17.34 | ||
| Turnout | 51,295 | 86.73 | +11.01 | ||
| Registered electors | 59,141 | ||||
| Conservative hold | Swing | ||||
Elections in the 1940s
| Party | Candidate | Votes | % | ±% | |
|---|---|---|---|---|---|
| Conservative | Sidney Marshall | 19,431 | 46.04 | ||
| Labour | Helen O. Judd | 17,293 | 40.97 | ||
| Liberal | John Pickering Hughes | 5,483 | 12.99 | ||
| Majority | 2,138 | 5.07 | |||
| Turnout | 42,207 | 75.72 | |||
| Registered electors | 55,742 | ||||
| Conservative win (new seat) | |||||
See also
Notes
References
External links
- Politics Resources (Election results from 1922 onwards)
- Electoral Calculus (Election results from 1955 onwards)
- Sutton and Cheam UK Parliament constituency (boundaries April 2010 – May 2024) at MapIt UK
- Sutton and Cheam UK Parliament constituency (boundaries from June 2024) at MapIt UK