Denmark's western electrical grid is part of the Synchronous grid of Continental Europe whereas the eastern part is connected to the Synchronous grid of Northern Europe via Sweden.
.JPG)

In 2022, Denmark produced 35 Terawatt-hours (TWh) of electricity, with renewable sources constituting 83.3% of the total electricity mix. Wind energy was the largest contributor at 54%, followed by bioenergy and waste at 23%, and solar energy at 6.3%. Coal accounted for 13% of electricity generation, while natural gas and oil combined for a smaller share of 3.8%.[1][2]
Interconnectors to neighboring countries, in particular Norway which exports hydroelectricity and Sweden which exports mostly hydroelectricity and nuclear electricity, provide extra power when electricity consumption exceeds generation. The combination of domestic wind power and Norwegian hydroelectricity provides a stable source of renewable, non-biomass electricity (which would be harder to achieve on wind power alone, without energy storage).
Denmark is a net importer of electricity. The flow of electricity between Denmark and the countries it has interconnectors with (Norway, Sweden, Germany and the Netherlands), and the direction of that flow, is highly variable and depends on current demand and current Danish wind power output.
Danish average consumption of electricity per person was 0.8 MWh less than EU 15 average in 2008. Denmark has average electricity costs (including costs for cleaner energy) in EU,[3] but general taxes increase the price to the highest in Europe.[4] In 2015, supply security was over 99.99%, among the highest in the world.[5]
The Danish electricity market is a part of the Nord Pool Spot power exchange.
Sources
Wind
Denmark invested in the wind power development in the 1970s and has had the highest wind share in the world ever since; wind produced the equivalent of 42% of Denmark's total electricity consumption in 2015.[6][7] Danish consumption of wind turbine generated electricity is the highest in the world per person: 1,218 kWh in 2009. Denmark produced more wind power per person in Denmark in 2009 than either Spain or the UK produced nuclear power per person in their respective countries.
In 2022, Denmark led all International Energy Agency (IEA) member countries in wind energy utilization for electricity generation, holding a 54% share, notably above the IEA average of 13%. The country's dedication to wind power, coupled with the expansion of other renewable energies, significantly reduced the carbon intensity of its electricity production to 92 grams of CO2 per kilowatt-hour (g CO2/kWh).[1][2]
Coal
In 2022, Denmark generated 34 TWh of electricity. Over the preceding decade, there was a significant change in the composition of its electricity generation, with the share of coal decreasing from 43% to 13%.[1][2]
Natural gas
Over the last twenty years, Denmark has seen a significant reduction in natural gas production, declining from 30% in 2005 to 13% in 2022. In parallel, the utilization of natural gas for electricity generation has dropped from 24% to 3%, and its contribution to the Total Energy Supply (TES) has decreased from 23% to 9%.[1][2]
Oil
In 2022, oil made up 37% of Denmark's TES, aligning with the International Energy Agency's (IEA) average of 35%. The share of oil in Denmark's energy supply has been consistent over the past decade. Although it represents a notable portion of the overall energy mix, oil's contribution to electricity generation has been minimal since 2005, contributing less than 0.9% to the country's total electricity production in 2022.[1][2]
Gross electricity consumption & production in GWh with renewables share
| Production | Consumption | Import-Export | Fossil | Nuclear | RE Bio & Waste | Wind Onshore | Wind Offshore | Total Wind % of Consumption | Total RE % of Consumption | Kg CO2 per MWh Produced | ||
|---|---|---|---|---|---|---|---|---|---|---|---|---|
| 2005 | 36400 | 35130 | 1370 | 23526 | 0 | 3545 | 5236 | 1428 | 19% | 29% | 571 | |
| 2006 | 45742 | 35974 | -6934 | 33264 | 0 | 3514 | 4739 | 1368 | 17% | 27% | 619 | |
| 2007 | 39371 | 36069 | -955 | 26318 | 0 | 3506 | 5800 | 1370 | 20% | 30% | 588 | |
| 2008 | 36723 | 36103 | 1454 | 24053 | 0 | 3592 | 5453 | 1524 | 19% | 29% | 572 | |
| 2009 | 36482 | 34624 | 334 | 23892 | 0 | 3668 | 5046 | 1664 | 19% | 30% | 586 | |
| 2010 | 38882 | 35483 | -1135 | 24010 | 0 | 4780 | 5122 | 2686 | 22% | 35% | 542 | |
| 2011 | 35040 | 34528 | 1318 | 18901 | 0 | 4527 | 6360 | 3405 | 28% | 41% | 498 | |
| 2012 | 30689 | 34135 | 5214 | 14052 | 0 | 4583 | 6796 | 3472 | 30% | 44% | 458 | |
| 2013 | 34823 | 34037 | 1081 | 16669 | 0 | 4631 | 6772 | 4351 | 33% | 46% | 452 | |
| 2014 | 32161 | 33471 | 2855 | 12405 | 0 | 4519 | 7913 | 5165 | 39% | 53% | 391 | |
| 2015 | 28931 | 33616 | 5912 | 8512 | 0 | 4436 | 9300 | 4833 | 42% | 55% | 335 | |
| 2016 | 30199 | 33018 | 5057 | 10499 | 0 | 4885 | 8132 | 4650 | 39% | 56% | 368 | |
| 2017 | 30662 | 33006 | 4563 | 7798 | 0 | 6071 | 9597 | 5180 | 45% | 66% | 285 | |
| Note 1: All numbers are gross which includes losses from transmission, distribution and self-consumption by fossil thermal plants making total production and consumption larger as well as making the non-thermal renewable share smaller, e.g. renewables production made up 49.2% of net generation during 2012.[8] Note 2: Wind conditions fluctuate from year to year and changes to precipitation over Scandinavia significantly affects hydro production in Norway and Sweden which in turn affects imports and exports, e.g. 2006. Note 3: Photovoltaics first had a significant effect in 2012. Due to this electricity being seen by the grid as self-consumption it in part caused gross consumption to drop by 1% from 2011 to 2012.[8] Note 4: Sources are from the publicly owned transmission grid authority Energinet.dk with their Environmental Reports 2006, 2007, 2008, 2010, 2012, 2013, 2014, 2015 & 2018 [9] | ||||||||||||
Consumption
| External images | |
|---|---|
 EU industry electricity prices EU industry electricity prices | |
| EU household electricity prices | |
| Composition of consumer price, 2005-2019 |
According to Nordel annual statistics Denmark's total electricity consumption totaled 36,392 GWh in 2006. Consumption increased about 3% in the period from 2001 to 2006 (in the same time-frame Sweden saw a 3% reduction, Norway a 2% reduction and Finland a 10% increase).[10]
As of 2009[update] Danish consumption of wind-generated electricity topped the world per person: 1,218 kWh. The renewable electricity-sources may give some protection against high annual changes.[citation needed] Electricity consumption fell in Denmark only 4% in the 2009-2008 recession (while falling 7.1% in Sweden, 7.9% in Finland and 8.6% in the UK; in Iceland consumption fell only 0.9%). Danish average consumption of electricity per person was 0.8 MWh less than the EU 15 average of 7.4 MWh in 2008.[11]
How price of consumer electricity is composed in Denmark, 2015[12]
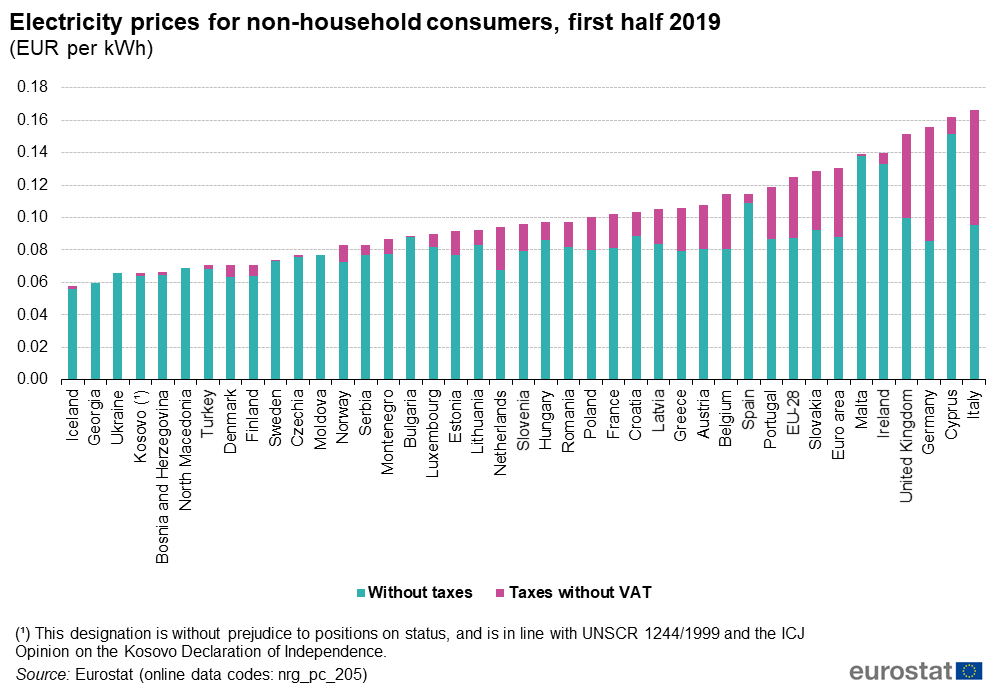
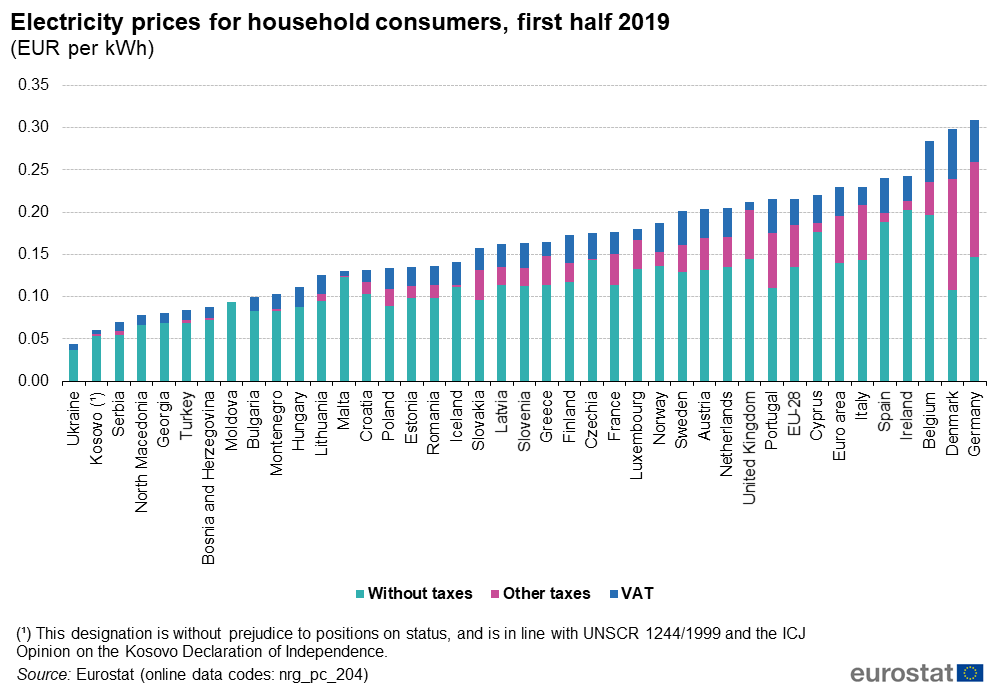
In 2019, Danish industry paid around 8 eurocent/kWh for the electricity cost, less than the EU average of 12 c.[13]In 2014, Danish industry paid around 32øre/kWh for the electricity cost,[3] about EU average. Denmark has average electricity costs (including consumer-paid incentives (PSO); costs for cleaner energy) in EU,[14][15][16] but taxes increase the consumer price to the highest in Europe[17] at around EUR 0.30/kWh.[4]
PSO is used for wind, biomass, solar, and district heating; total PSO was DKK 5.8 billion in 2013, of which DKK 3.2 billion went to wind power.[18] In 2015, the cost of power was only 32% of the price, while PSO was 9%, and tolls and VAT the remaining 59%.[12]
As new data centers come online, Energinet.dk expects consumption to increase by 3.8 TWh in 2023 and by 13 TWh in 2040, compared to 2015.[19]
Due to exchange with other countries, Danish consumption of electricity is different from its production.[20] The Environment declaration shows how the physical power is composed of different fuel sources.[21] The General Declaration differs due to trade with green certificates, and does not show actual composition.[22][23] Due to more wind in Denmark and more precipitation in Norway and Sweden, Danish electricity went from 1,216 kg CO2 per household in 2014 to 808 kg in 2015 (182g/kWh in 2014).[24] 58% came from wind, water and sun, 19% from coal&lignite, and 4% from nuclear.[25]
In 2022, Denmark produced 35 Terawatt-hours (TWh) of electricity and consumed 32 TWh. The industrial sector was the largest electricity consumer, at 36% of total consumption, followed closely by residential buildings at 31%, and the services sector buildings at 30%. The transport sector had the smallest share, at 2.9%.[1][2]
| Coal&lignite | Nuclear | Natural gas | Wind, hydro, solar | Biomass&waste | Oil | |
|---|---|---|---|---|---|---|
| Environment declaration[21][22] | 30% | 3% | 7% | 47% | 13% | 0% |
Production
| External image | |
|---|---|
| Electricity production by source, 2000-2020 | |
| Power supply map, 1985 and 2015 |
Mode of production
The total installed power capacity was 12.5 GW in 2001 and in the end of 2006 12.7 GW including 9.5 GW from natural gas, coal and oil and 3.1 GW wind power.[10]Denmark has almost no hydropower,[26] and no pumped storage.[27] Denmark had the 6th best energy security in the world in 2014, although this includes non-electrical energy.[28] Denmark has 1250 MW of methane-fueled distributed power plants supplying district heating. Their electricity production decreased to a third during the ten years from 2010 to 2019, but power capacity remained the same.[29]Current power system data are provided by Energinet.dk and EMD.
Power stations
Producers
Main power producing companies operating in the Danish market are Ørsted A/S and Vattenfall. The current market structure was designed in 2003–2006 by a number of mergers and transactions. In January 2003, Ørsted (then called DONG Energy) acquires a 64% share in the regional power company EnergiGruppen Jylland, which owned 3.1% of the electricity producer Elsam. At the same year Elsam acquired 78.8% of retail sales operator NESA and later took a full control of the company. At the same time, NESA owned 36% in other electricity producer Energy E2. In 2004, EnergiGruppen Jylland increased its stake in Elsam to 24% and on 10 December 2004 Ørsted and Elsam announce announced their planned merger. Ørsted increased its stake in Elsam to 64.7% while Swedish power producer Vattenfall had acquired a blocking stake of 35.3%.[30]
In 2005, Ørsted purchased municipal utilities Københavns Energi and Frederiksberg Forsyning, including their 34% and 2.26% stakes in Energi E2. In May 2005, Ørsted and Vattenfall agreed split of assets in Elsam and Energi E2. Vattenfall received Amager Power Station, Fyn Power Station, Nordjylland Power Station, two decentralised gas-fired plants in Zealand, a portfolio of Danish and international wind activities, and a 30% stake in a German wind development for exchange of Vattenfall's 35% stake in Elsam and 40% stake in the Avedøre 2 Power Station. The agreement and merger of Ørsted, Elsam, NESA, Københavns Energi, and Frederiksberg Forsyning to form Ørsted Energy was approved by the European Commission in 2006 and consequently came into force on 2 July 2006.[10][30]
Due to a reduction in PSO-money, combined heat and power plants receive an estimated DKK 2.5 billion less in 2019.[31]
Competition
The Danish Council decided that the Danish producer Elsam (now Ørsted) abused its dominant position in Denmark to raise prices in the period 2003–2006.[10]
Coal transition
Since 2006, Denmark has seen a steady decline in coal use for electricity generation, with demand dropping by 80% since 2005, notwithstanding a slight uptick in 2021. The country, lacking domestic coal production, has primarily relied on coal imports from Russia, South Africa, and Colombia. However, these imports have decreased by 90% since 2005. Reacting to Russia's invasion of Ukraine in February 2022, Denmark ceased all coal imports from Russia. The shift from coal is progressing, with an anticipated complete phase-out in heat and electricity production by 2028. Ørsted is set to end coal use in its co-generation plants by January 2023. Furthermore, the Fynsværket plant in Odense is moving to gas, while the Nordjyllandsværket plant in Aalborg is scheduled to shut down by 2028.[1][2]
Trade
Over the past 15 years, Denmark has primarily been a net importer of electricity, except in 2006, 2007, and 2010 when it was a net exporter. The trend towards increased net imports commenced between 2013 and 2015, coinciding with the nation's phase-out of coal-fired power generation, and since then, net imports have remained steady at around 5 Terawatt-hours (TWh) annually through 2021. In 2022, Denmark exported 7.5 TWh of electricity to Germany and the Netherlands and imported 10 TWh from Norway and Sweden. Looking ahead, Denmark is anticipated to shift towards becoming a net exporter, facilitated by the expansion of interconnector capacities, the launch of the Viking Link—a 1,400 MW high-voltage direct current (DC) interconnector with the United Kingdom—and an increase in wind power generation.[1][2]
Transmission

Denmark has two separate transmission systems, of which the eastern one is synchronous with Nordic (former NORDEL) and the western one with the synchronous grid of Continental Europe.[32] The 600 MW DC Great Belt Power Link connecting the two systems was commissioned only in July 2010, started commercial operations in August 2010, and was inaugurated on 7 September 2010.[10][33] The Little Belt cables are 400 kV AC at 1,100 MW[34] and replaced overhead wires in 2013.[35] Bornholm is connected to Scania in Sweden through a cable.
The Danish transmission system is owned and operated by Energinet.dk, which was created by a merger of power grid operators Eltra, Elkraft System and Elkraft Transmission, and by natural gas transmission system operator Gastra. The merger took place on 24 August 2005 with retrospective effect from 1 January 2005.[36] Eltra and Elkraft were communally owned by the respective region's distribution companies (Eltra west of the Great Belt and Elkraft east of it). The high-voltage transmission assets were transferred to the Danish State and later to Energinet.dk at no cost.[37] Since 1997, Elkraft and Eltra operated as fully unbundled companies from the power generating companies.[38]
As of 2014[update], nearly all low-voltage (<10 kV) power lines run as underground cables. For medium voltage around 50-60 kV 40% are buried, while 25% of high-voltage (132-400 kV) are ground cables.[39] As of 2015[update], Denmark has about 2-3% transmission losses.[40]
Denmark sits at an electricity crossroads between the larger electricity markets in Scandinavia and Germany, and facilitates power trade between these. In 2014, electricity generation was 592 TWh in Germany, 150 TWh in Sweden, 141 TWh in Norway, and 31 TWh in Denmark.[41]
Several direct current cables connect the two Danish systems to neighboring countries. The western Danish power grid is connected to Norway with 1,700 MW (Skagerrak) and Sweden with 740 MW (Konti–Skan). The 700 MW (COBRAcable) connects Jutland and the Netherlands,[42][43] and the 1,400 MW Viking Link is planned to connect Jutland and England.[44]
Larger alternating current connections also exist; 1,780 MW between Germany and Jutland,[45] and a second 400kV AC line is planned between Jutland and Germany.[44]
East Denmark is connected to Germany with 600 MW DC (Kontek) and the 400 MW cable via the Kriegers Flak offshore wind farm.[46][47] Zealand can import 1,700 MW from Sweden (export capacity is less).[48]
Synchronous condensers (syncons) assist grid stability; 3 in the western grid and 2 in the eastern grid, some with capacities reaching -140 to 270 MVAr. A limit of ±15 MVAr is set as a measure of grid quality.[49]
Total export and import capacities were 2,510 MW and 2,870 MW respectively in 2007. The actual import and export capacities were typically 60% of the nominal capacities. Studies showed inefficient markets in 2006.[10][32] In 2014 (before cables to Netherlands and Kriegers), Denmark had an electricity interconnection level (transmission capacity relative to production capacity) of 44%, compared to Slovakia at 61% and Hungary at 29%.[50]
See also


References
External links
- Statistics from 2006 (in Danish), figure 10 shows the distribution companies and figure 44 the transmission grid
- High voltage grid of Denmark Archive, Export capacities in XLS spreadsheet