East Northamptonshire District Council in Northamptonshire, England was elected every four years. After the last boundary changes in 2007, 40 councillors were elected from 22 wards.[1] The district was abolished in 2021, with the area becoming part of North Northamptonshire.
Political control
From the first election to the council in 1973 until its abolition in 2021, political control of the council was held by the following parties:[2]
| Party in control | Years | |
|---|---|---|
| Conservative | 1973–1995 | |
| Labour | 1995–1999 | |
| Conservative | 1999–2021 | |
Leadership
The leaders of the council from 2009 until the council's abolition in 2021 were:
| Councillor | Party | From | To | |
|---|---|---|---|---|
| Andy Mercer | Conservative | Oct 2010 | ||
| Steven North[3] | Conservative | 4 Oct 2010 | 31 Mar 2021 | |
Council elections
- 1973 East Northamptonshire District Council election
- 1976 East Northamptonshire District Council election
- 1979 East Northamptonshire District Council election (New ward boundaries)[4]
- 1983 East Northamptonshire District Council election
- 1987 East Northamptonshire District Council election
- 1991 East Northamptonshire District Council election
- 1995 East Northamptonshire District Council election
- 1999 East Northamptonshire District Council election (New ward boundaries)[5][6]
- 2003 East Northamptonshire District Council election
- 2007 East Northamptonshire District Council election (New ward boundaries increased the number of seats by 4)[2][7]
- 2011 East Northamptonshire District Council election
- 2015 East Northamptonshire District Council election (Some new ward boundaries)[8]
Election results
| Overall control | Conservative | Labour | Lib Dem[a] | Independent | |||||
| 2015 | Conservative | 37 | 1 | - | 2 | ||||
| 2011 | Conservative | 35 | 2 | - | 3 | ||||
| 2007 | Conservative | 39 | - | - | 1 | ||||
| 2003 | Conservative | 33 | 3 | - | - | ||||
| 1999 | Conservative | 20 | 15 | - | 1 | ||||
| 1995 | Labour | 9 | 25 | 2 | - | ||||
| 1991 | Conservative | 23 | 9 | 3 | 1 | ||||
| 1987 | Conservative | 30 | 5 | 1 | - | ||||
| 1983 | Conservative | 30 | 6 | - | - | ||||
| 1979 | Conservative | 30 | 5 | - | 1 | ||||
District result maps
 1979 results map
 1983 results map
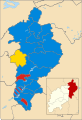 1987 results map
 1991 results map
 1995 results map
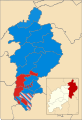 1999 results map
 2003 results map
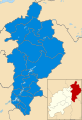 2007 results map
 2011 results map


By-election results
1995-1999
| Party | Candidate | Votes | % | ±% | |
|---|---|---|---|---|---|
| Labour | 656 | 75.4 | |||
| Conservative | 214 | 24.6 | |||
| Majority | 442 | 50.8 | |||
| Turnout | 870 | 22.4 | |||
| Labour hold | Swing | ||||
| Party | Candidate | Votes | % | ±% | |
|---|---|---|---|---|---|
| Labour | 325 | 65.1 | |||
| Conservative | 174 | 34.9 | |||
| Majority | 151 | 30.2 | |||
| Turnout | 499 | ||||
| Labour hold | Swing | ||||
| Party | Candidate | Votes | % | ±% | |
|---|---|---|---|---|---|
| Labour | 365 | 43.3 | |||
| Conservative | 352 | 41.7 | |||
| Independent | 127 | 15.1 | |||
| Majority | 13 | 1.6 | |||
| Turnout | 844 | 18.5 | |||
| Labour hold | Swing | ||||
| Party | Candidate | Votes | % | ±% | |
|---|---|---|---|---|---|
| Labour | 712 | 67.0 | |||
| Conservative | 351 | 33.0 | |||
| Majority | 361 | 34.0 | |||
| Turnout | 1,063 | ||||
| Labour hold | Swing | ||||
| Party | Candidate | Votes | % | ±% | |
|---|---|---|---|---|---|
| Conservative | 525 | 55.7 | +15.2 | ||
| Labour | 418 | 44.3 | -15.2 | ||
| Majority | 107 | 11.4 | |||
| Turnout | 943 | 16.1 | |||
| Conservative gain from Labour | Swing | ||||
1999-2003
| Party | Candidate | Votes | % | ±% | |
|---|---|---|---|---|---|
| Conservative | 316 | 64.5 | -6.6 | ||
| Labour | 174 | 35.5 | +6.6 | ||
| Majority | 142 | 29.0 | |||
| Turnout | 490 | 37.9 | |||
| Conservative hold | Swing | ||||
| Party | Candidate | Votes | % | ±% | |
|---|---|---|---|---|---|
| Conservative | 366 | 83.9 | |||
| Labour | 70 | 16.1 | |||
| Majority | 296 | 67.8 | |||
| Turnout | 436 | ||||
| Conservative hold | Swing | ||||
| Party | Candidate | Votes | % | ±% | |
|---|---|---|---|---|---|
| Conservative | 379 | 67.7 | -3.4 | ||
| Labour | 181 | 32.3 | +3.4 | ||
| Majority | 198 | 35.4 | |||
| Turnout | 560 | ||||
| Conservative hold | Swing | ||||
2003-2007
| Party | Candidate | Votes | % | ±% | |
|---|---|---|---|---|---|
| Conservative | unopposed | ||||
| Conservative hold | Swing | ||||
| Party | Candidate | Votes | % | ±% | |
|---|---|---|---|---|---|
| Conservative | Sean Lever | 506 | 66.4 | +21.5 | |
| Labour | Stephen Allen | 256 | 33.6 | -2.9 | |
| Majority | 250 | 32.8 | |||
| Turnout | 762 | 15.8 | |||
| Conservative hold | Swing | ||||
2007-2011
| Party | Candidate | Votes | % | ±% | |
|---|---|---|---|---|---|
| Conservative | Pam Whiting | unopposed | |||
| Conservative hold | Swing | ||||
2011-2015
| Party | Candidate | Votes | % | ±% | |
|---|---|---|---|---|---|
| Conservative | Derek Capp | 412 | 64.1 | N/A | |
| Liberal Democrats | Karen Draycott | 130 | 20.2 | N/A | |
| Labour | Phil Garnham | 101 | 15.7 | N/A | |
| Majority | 282 | 43.9 | |||
| Turnout | 643 | ||||
| Conservative hold | Swing | ||||
| Party | Candidate | Votes | % | ±% | |
|---|---|---|---|---|---|
| Conservative | Jake Vowles | 1,003 | 52.4 | -13.7 | |
| Labour | Paul King | 681 | 35.6 | +1.7 | |
| Liberal Democrats | George Smid | 230 | 12.0 | +12.0 | |
| Majority | 322 | 16.8 | |||
| Turnout | 1,914 | ||||
| Conservative hold | Swing | ||||
| Party | Candidate | Votes | % | ±% | |
|---|---|---|---|---|---|
| Conservative | Alex Smith | 396 | 43.1 | -12.4 | |
| Independent | Valerie Carter | 210 | 22.9 | +22.9 | |
| Labour | Alex Izycky | 166 | 18.1 | +18.1 | |
| UKIP | Joseph Garner | 146 | 15.9 | +15.9 | |
| Majority | 186 | 20.3 | |||
| Turnout | 918 | ||||
| Conservative hold | Swing | ||||
2015-2021
| Party | Candidate | Votes | % | ±% | |
|---|---|---|---|---|---|
| Conservative | Annabel de Capell Brooke | 729 | 82.8 | +6.7 | |
| Labour | Alan Brookfield | 151 | 17.2 | +2.8 | |
| Majority | 578 | 65.6 | |||
| Turnout | 880 | ||||
| Conservative hold | Swing | ||||
| Party | Candidate | Votes | % | ±% | |
|---|---|---|---|---|---|
| Conservative | Harriet Pentland | 611 | 55.6 | N/A | |
| Liberal Democrats | Suzanna Austin | 244 | 22.2 | N/A | |
| Labour | Mark Smith | 189 | 17.2 | N/A | |
| Green | Simon Turner | 33 | 3.0 | N/A | |
| UKIP | Bill Cross | 22 | 2.0 | N/A | |
| Majority | 367 | 33.4 | |||
| Turnout | 1,099 | ||||
| Conservative hold | Swing | ||||
| Party | Candidate | Votes | % | ±% | |
|---|---|---|---|---|---|
| Conservative | Lee Wilkes | 542 | 53.1 | -2.3 | |
| Labour | Caroline Cross | 478 | 46.9 | +11.7 | |
| Majority | 64 | 6.3 | |||
| Turnout | 1,020 | ||||
| Conservative hold | Swing | ||||
| Party | Candidate | Votes | % | ±% | |
|---|---|---|---|---|---|
| Conservative | Bert Jackson | 1,379 | 63.3 | +16.1 | |
| Liberal Democrats | Suzanna Austin | 800 | 36.7 | +36.7 | |
| Majority | 579 | 26.6 | |||
| Turnout | 2,179 | ||||
| Conservative hold | Swing | ||||
| Party | Candidate | Votes | % | ±% | |
|---|---|---|---|---|---|
| Conservative | Peter Tomas | 1,531 | 62.6 | N/A | |
| Liberal Democrats | Simon Baylis | 913 | 37.4 | N/A | |
| Majority | 618 | 25.2 | |||
| Turnout | 2,444 | ||||
| Conservative hold | Swing | ||||
References
- By-election results Archived 29 March 2010 at the Wayback Machine
External links
🔥 Top keywords: Main PageSpecial:SearchPage 3Wikipedia:Featured picturesHouse of the DragonUEFA Euro 2024Bryson DeChambeauJuneteenthInside Out 2Eid al-AdhaCleopatraDeaths in 2024Merrily We Roll Along (musical)Jonathan GroffJude Bellingham.xxx77th Tony AwardsBridgertonGary PlauchéKylian MbappéDaniel RadcliffeUEFA European Championship2024 ICC Men's T20 World CupUnit 731The Boys (TV series)Rory McIlroyN'Golo KantéUEFA Euro 2020YouTubeRomelu LukakuOpinion polling for the 2024 United Kingdom general electionThe Boys season 4Romania national football teamNicola CoughlanStereophonic (play)Gene WilderErin DarkeAntoine GriezmannProject 2025