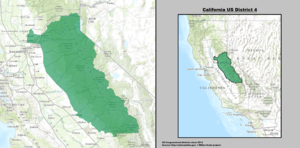
California's 4th congressional district is a U.S. congressional district in California. The district is located in the northwestern part of the state, and includes all of Lake County and Napa County, most of Yolo County, and parts of Solano County and Sonoma County. Major cities in the district include Davis, Woodland, Napa, Vacaville, and most of Santa Rosa. The new 4th district is solidly Democratic, and is represented by Mike Thompson.[1]
| California's 4th congressional district | |
|---|---|
Interactive map of district boundaries since 2023 (Used in the 2022 elections) | |
| Representative | |
| Population (2022) | 765,203[1] |
| Median household income | $87,319[2] |
| Ethnicity |
|
| Cook PVI | D+17[3] |
.svg)

From 2013 to 2023, the district encompassed the Sierras from Truckee to the Sequoia National Forest, as well as a largely suburban area on the edge of the Sacramento Valley in southwestern Placer County. It consisted of Alpine, Amador, Calaveras, El Dorado, Mariposa, and Tuolumne counties plus most of Placer County and portions of Fresno, Madera, and Nevada counties. The district was represented by Republican Tom McClintock.[4]
Competitiveness
In 2006, Republicans had 48 percent of voter registrations, Democrats had 30 percent, and Libertarians had roughly 5 percent.[5] A Democratic congressional candidate nearly won the district in 2008, losing by only half a percentage point and less than 1,600 votes, indicating that the district was much more competitive than it appeared to be.
New district boundaries for the 2012 elections shifted the population center to the south and east. Registered Democrats and Independents/Decline to State voters in the new district area outnumber registered Republicans by 12%. However, Republicans, Independents/Decline to State, and small third parties outnumber Democrats well over a 2 to 1 ratio. There were 183,800 Republicans, 117,300 Democrats, and 97,200 others.[6] In presidential elections, Donald Trump won the district in 2016 with 54% of the vote and won in 2020 with 53.7% of the vote. In the 2018 and 2020 elections, the Republican candidate won over 53% of the vote.[7]
In the 2020 redistricting, the district was shifted again to the San Francisco Bay Area. It includes all of Lake County and Napa County, most of Yolo County, and parts of Solano County and Sonoma County. Major cities in the district include Davis, Woodland, Napa, Vacaville, and most of Santa Rosa. The new 4th district is solidly Democratic, and is represented by Mike Thompson.[1] The Solano County portion including Vacaville and Dixon have consistently been more conservative as evidenced by the 2022 midterms, voters in Congressional District 4 favored the Republican candidate 50.3% to 49.7%.[8]
Recent voting history
| Election results from statewide races | ||
|---|---|---|
| Year | Office | Results |
| 1992 | President | Bush (R) 40.7 - 33.9% |
| Senator | Herschensohn (R) 50.0 - 39.7% | |
| Senator | Feinstein (D) 46.0 - 45.2% | |
| 1994 | Governor | Wilson (R) 66.4 - 29.0% |
| Senator | ||
| 1996 | President | Dole (R) 51.3 - 37.8% |
| 1998 | Governor | |
| Senator | ||
| 2000 | President[9] | Bush (R) 58.1 - 36.9% |
| Senator[10] | Campbell (R) 51.1 - 41.8% | |
| 2002 | Governor[11] | Simon (R) 58.5 - 30.6% |
| 2003 | Recall[12][13] |  Yes 70.4 - 29.6% Yes 70.4 - 29.6% |
| Schwarzenegger (R) 60.6 - 17.6% | ||
| 2004 | President[14] | Bush (R) 61.3 - 37.4% |
| Senator[15] | Jones (R) 55.6 - 40.1% | |
| 2006 | Governor[16] | Schwarzenegger (R) 72.2 - 22.8% |
| Senator[17] | Mountjoy (R) 50.2 - 44.3% | |
| 2008 | President[18] | McCain (R) 54.0 - 43.8% |
| 2010 | Governor[19] | Whitman (R) 55.3 - 39.3% |
| Senator[20] | Fiorina (R) 59.5 - 33.7% | |
| 2012 | President | Romney (R) 57.9 - 39.5% |
| Senator | Emken (R) 58.5 - 41.5% | |
| 2014 | Governor | Kashkari (R) 55.1 - 44.9% |
| 2016 | President | Trump (R) 54.0 - 39.3% |
| Senator | Harris (D) 63.3 - 36.7% | |
| 2018 | Governor | Cox (R) 59.5 - 40.5% |
| Senator | de Leon (D) 54.7 - 45.3% | |
| 2020 | President | Trump (R) 53.7 - 43.9% |
| 2021 | Recall[21] | Yes 58.9 - 41.1% |
| 2022 | Governor[22] | Newsom (D) 63.3 - 36.7% |
| Senator | Padilla (D) 65.7 - 34.3% | |
Composition
| # | County | Seat | Population |
|---|---|---|---|
| 33 | Lake | Lakeport | 68,766 |
| 55 | Napa | Napa | 136,207 |
| 113 | Yolo | Woodland | 216,986 |
As of 2023, California's 4th congressional district encompasses Lake, Napa, and Yolo Counties, and parts of Sonoma and Solano Counties.
Sonoma County is split between this district and the 2nd district. They are partitioned by Petaluma River, Highway 116, Redwood Highway, Robber Rd, Petersen Rd, Llano Rd, S Wright Rd, W College Ave, Jennings Ave, Administration Dr, Bicentennial Way, Cleveland Ave, Old Redwood Highway, Cross Creek Rd, Sonoma Highway, and Sonoma Creek. The 4th district takes in the cities of Santa Rosa, Rohnert Park, Sonoma, and Cotati, the town of Windsor, and the census-designated places of Boyes Hot Spring, Roseland, El Verano, Penngrove.
Solano County is split between this district and the 8th district. They are partitioned by Soda Springs Rd, Union Pacific, Alamo Dr, Leisure Town Rd, Hawkins Rd, Bay Area Exxextric, Shilo Rd, Collinsville Rd, and Montezuma Slough. The 4th district takes in the city of Vacaville, Dixon, Rio Vista, and the census-designated place of Hartley.
Cities & CDP with 10,000 or more people
- Vacaville - 102,386
- Napa - 77,480
- Davis - 66,850
- Woodland - 55,229
- West Sacramento - 53,519
- American Canyon - 21,837
- Dixon - 18,974
- Clearlake - 15,134
2,500-10,000 people
- University of California, Davis - 6,805
- Hidden Valley Lake - 6,243
- Winters - 6,616
- St. Helena - 5,939
- Calistoga - 5,266
- Lakeport - 4,799
- North Lakeport - 3,514
- Angwin - 3,179
- Yountville - 2,984
- Kelseyville - 2,923
- Clearlake Riviera - 2,850
- Esparto - 2,877
List of members representing the district


.jpg)

.jpg)


.jpg)
.jpg)
.jpg)


.jpg)
_(new_version).svg)
Election results for representatives
1872 • 1874 • 1876 • 1878 • 1880 • 1882 • 1884 • 1886 • 1888 • 1890 • 1892 • 1894 • 1896 • 1898 • 1900 • 1902 • 1904 • 1906 • 1908 • 1910 • 1912 • 1914 • 1916 • 1918 • 1920 • 1922 • 1924 • 1926 • 1928 • 1930 • 1932 • 1934 • 1936 • 1938 • 1940 • 1942 • 1944 • 1946 • 1948 • 1950 • 1952 • 1954 • 1956 • 1958 • 1960 • 1962 • 1964 • 1966 • 1968 • 1970 • 1972 • 1974 • 1976 • 1978 • 1980 • 1982 • 1984 • 1986 • 1988 • 1990 • 1992 • 1994 • 1996 • 1998 • 2000 • 2002 • 2004 • 2006 • 2008 • 2010 • 2012 • 2014 • 2016 • 2018 • 2020 • 2022 |
1872
| Party | Candidate | Votes | % | |
|---|---|---|---|---|
| Republican | Sherman Otis Houghton (Incumbent) | 10,391 | 53.5 | |
| Democratic | Edward J. Kewen | 9,012 | 46.5 | |
| Total votes | 19,403 | 100.0 | ||
| Turnout | ||||
| Republican hold | ||||
1874
| Party | Candidate | Votes | % | |||
|---|---|---|---|---|---|---|
| Democratic | Peter D. Wigginton | 15,649 | 48.8 | |||
| Republican | Sherman Otis Houghton (Incumbent) | 11,090 | 34.6 | |||
| Independent | J. S. Thompson | 5,343 | 16.7 | |||
| Total votes | 32,082 | 100.0 | ||||
| Turnout | ||||||
| Democratic gain from Republican | ||||||
1876
| Party | Candidate | Votes | % | |||
|---|---|---|---|---|---|---|
| Republican | Romualdo Pacheco | 19,104 | 50.0 | |||
| Democratic | Peter D. Wigginton (Incumbent) | 19,103 | 50.0 | |||
| Total votes | 38,207 | 100.0 | ||||
| Turnout | ||||||
| Republican gain from Democratic | ||||||
1878
| Party | Candidate | Votes | % | |
|---|---|---|---|---|
| Republican | Romualdo Pacheco | 15,391 | 40.5 | |
| Democratic | Wallace A. Leach | 12,109 | 31.8 | |
| Workingman's | James J. Ayres [23] | 10,527 | 27.7 | |
| Total votes | 38,027 | 100.0 | ||
| Turnout | ||||
| Republican hold | ||||
1880
| Party | Candidate | Votes | % | |
|---|---|---|---|---|
| Republican | Romualdo Pacheco (Incumbent) | 17,768 | 45.8 | |
| Democratic | Wallace A. Leach | 17,577 | 45.3 | |
| Greenback | J. F. Godfrey | 3,435 | 8.9 | |
| Total votes | 38,780 | 100.0 | ||
| Turnout | ||||
| Republican hold | ||||
1882
| Party | Candidate | Votes | % | |||
|---|---|---|---|---|---|---|
| Democratic | Pleasant B. Tully | 23,105 | 54.4 | |||
| Republican | George Lemuel Woods | 18,387 | 43.3 | |||
| Populist | M. V. Wright | 650 | 1.5 | |||
| Prohibition | Isaac Kinley | 355 | 0.8 | |||
| Total votes | 42,497 | 100.0 | ||||
| Turnout | ||||||
| Democratic gain from Republican | ||||||
1884
| Party | Candidate | Votes | % | |||
|---|---|---|---|---|---|---|
| Republican | William W. Morrow | 15,083 | 58.8 | |||
| Democratic | R. P. Hastings | 10,422 | 40.6 | |||
| Populist | H. S. Fitch | 123 | 0.5 | |||
| Prohibition | George Babcock | 15 | 0.1 | |||
| Total votes | 25,643 | 100.0 | ||||
| Turnout | ||||||
| Republican gain from Democratic | ||||||
1886
| Party | Candidate | Votes | % | |
|---|---|---|---|---|
| Republican | William W. Morrow (Incumbent) | 11,413 | 48.6 | |
| Democratic | Frank McCoppin | 9,854 | 42.0 | |
| Independent | Charles Allen Sumner | 2,104 | 9.0 | |
| Prohibition | Robert Thompson | 84 | 0.4 | |
| Total votes | 23,455 | 100.0 | ||
| Turnout | ||||
| Republican hold | ||||
1888
| Party | Candidate | Votes | % | |
|---|---|---|---|---|
| Republican | William W. Morrow (Incumbent) | 14,217 | 50.8 | |
| Democratic | Robert Ferral | 13,624 | 48.6 | |
| Socialist | Frank M. Pixley | 173 | 0.6 | |
| Total votes | 28,014 | 100.0 | ||
| Turnout | ||||
| Republican hold | ||||
1890
| Party | Candidate | Votes | % | |
|---|---|---|---|---|
| Republican | John Tyler Cutting | 13,196 | 49.2 | |
| Democratic | Robert Ferral | 12,091 | 45.1 | |
| Socialist | Thomas V. Cator | 1,492 | 5.6 | |
| Prohibition | Joseph Rowell | 50 | 0.2 | |
| Total votes | 26,829 | 100.0 | ||
| Turnout | ||||
| Republican hold | ||||
1892
| Party | Candidate | Votes | % | |||
|---|---|---|---|---|---|---|
| Democratic | James G. Maguire | 14,997 | 49.2 | |||
| Republican | Charles O. Alexander | 13,226 | 43.4 | |||
| Populist | Edgar P. Burman | 1,980 | 6.5 | |||
| Prohibition | Henry Collins | 296 | 1.0 | |||
| Total votes | 30,499 | 100.0 | ||||
| Turnout | ||||||
| Democratic gain from Republican | ||||||
1894
| Party | Candidate | Votes | % | |
|---|---|---|---|---|
| Democratic | James G. Maguire (Incumbent) | 14,748 | 48.3 | |
| Republican | Thomas B. Shannon | 9,785 | 32.0 | |
| Populist | B. K. Collier | 5,627 | 18.4 | |
| Prohibition | Joseph Rowell | 388 | 1.3 | |
| Total votes | 30,548 | 100.0 | ||
| Turnout | ||||
| Democratic hold | ||||
1896
| Party | Candidate | Votes | % | |
|---|---|---|---|---|
| Democratic | James G. Maguire (Incumbent) | 19,074 | 61.0 | |
| Republican | Thomas B. O'Brien | 10,940 | 35.0 | |
| Socialist Labor | E. T. Kingsley | 968 | 3.0 | |
| Prohibition | Joseph Rowell | 299 | 1.0 | |
| Total votes | 31,281 | 100.0 | ||
| Turnout | ||||
| Democratic hold | ||||
1898
| Party | Candidate | Votes | % | |||
|---|---|---|---|---|---|---|
| Republican | Julius Kahn | 13,695 | 50.0 | |||
| Democratic | James H. Barry | 12,084 | 44.1 | |||
| Socialist Labor | W. J. Martin | 1,006 | 3.7 | |||
| Independent | Joseph P. Kelly | 594 | 2.2 | |||
| Total votes | 27,379 | 100.0 | ||||
| Turnout | ||||||
| Republican gain from Democratic | ||||||
1900
| Party | Candidate | Votes | % | |
|---|---|---|---|---|
| Republican | Julius Kahn (Incumbent) | 17,111 | 55.2 | |
| Democratic | R. Porter Ashe | 11,742 | 37.8 | |
| Independent | C. C. O'Donnell | 1,116 | 3.6 | |
| Socialist | G. B. Benham | 969 | 3.1 | |
| Prohibition | Joseph Rowell | 84 | 0.3 | |
| Total votes | 31,022 | 100.0 | ||
| Turnout | ||||
| Republican hold | ||||
1902
| Party | Candidate | Votes | % | |||
|---|---|---|---|---|---|---|
| Democratic | Edward J. Livernash | 16,146 | 49.2 | |||
| Republican | Julius Kahn (Incumbent) | 16,005 | 48.7 | |||
| Socialist | William Costley | 616 | 1.9 | |||
| Prohibition | Joseph Rowell | 69 | 0.2 | |||
| Total votes | 16,836 | 100.0 | ||||
| Turnout | ||||||
| Democratic gain from Republican | ||||||
1904
| Party | Candidate | Votes | % | |||
|---|---|---|---|---|---|---|
| Republican | Julius Kahn | 20,012 | 57.0 | |||
| Democratic | Edward J. Livernash (Incumbent) | 12,812 | 36.4 | |||
| Socialist | William Costley | 2,267 | 6.4 | |||
| Total votes | 35,091 | 100.0 | ||||
| Turnout | ||||||
| Republican gain from Democratic | ||||||
1906
| Party | Candidate | Votes | % | |
|---|---|---|---|---|
| Republican | Julius Kahn (Incumbent) | 5,678 | 62.4 | |
| Democratic | David S. Hirshberg | 3,016 | 33.2 | |
| Socialist | Oliver Everett | 399 | 4.4 | |
| Total votes | 9,093 | 100.0 | ||
| Turnout | ||||
| Republican hold | ||||
1908
| Party | Candidate | Votes | % | |
|---|---|---|---|---|
| Republican | Julius Kahn (Incumbent) | 9,202 | 52.7 | |
| Democratic | James G. Maguire | 7,497 | 42.9 | |
| Socialist | K. J. Doyle | 699 | 4.0 | |
| Prohibition | William N. Meserve | 60 | 0.3 | |
| Total votes | 17,458 | 100.0 | ||
| Turnout | ||||
| Republican hold | ||||
1910
| Party | Candidate | Votes | % | |
|---|---|---|---|---|
| Republican | Julius Kahn (Incumbent) | 10,188 | 56.5 | |
| Democratic | Walter MacArthur | 6,636 | 36.8 | |
| Socialist | Austin Lewis | 1,178 | 6.5 | |
| Prohibition | E. F. Dinsmore | 35 | 0.2 | |
| Total votes | 18,037 | 100.0 | ||
| Turnout | ||||
| Republican hold | ||||
1912
| Party | Candidate | Votes | % | |
|---|---|---|---|---|
| Republican | Julius Kahn (Incumbent) | 25,515 | 56.1 | |
| Democratic | Bert Schlesinger | 14,884 | 32.7 | |
| Socialist | Norman W. Pendleton | 5,090 | 11.2 | |
| Total votes | 45,489 | 100.0 | ||
| Turnout | ||||
| Republican hold | ||||
1914
| Party | Candidate | Votes | % | |
|---|---|---|---|---|
| Republican | Julius Kahn (Incumbent) | 41,044 | 69.1 | |
| Democratic | Henry Colombat | 13,550 | 22.8 | |
| Socialist | Allen K. Gifford | 3,928 | 6.6 | |
| Prohibition | J. C. Westenberg | 895 | 1.5 | |
| Total votes | 59,417 | 100.0 | ||
| Turnout | ||||
| Republican hold | ||||
1916
| Party | Candidate | Votes | % | |
|---|---|---|---|---|
| Republican | Julius Kahn (Incumbent) | 51,968 | 77.2 | |
| Democratic | J. M. Fernald | 10,579 | 15.7 | |
| Socialist | Allen K. Gifford | 3,775 | 5.6 | |
| Prohibition | Henry W. Hutchinson | 981 | 1.5 | |
| Total votes | 67,303 | 100.0 | ||
| Turnout | ||||
| Republican hold | ||||
1918
| Party | Candidate | Votes | % | |
|---|---|---|---|---|
| Republican | Julius Kahn (Incumbent) | 38,278 | 86.6 | |
| Socialist | Hugo Ernst | 5,913 | 13.4 | |
| Total votes | 43,191 | 100.0 | ||
| Turnout | ||||
| Republican hold | ||||
1920
| Party | Candidate | Votes | % | |
|---|---|---|---|---|
| Republican | Julius Kahn (Incumbent) | 50,841 | 84.6 | |
| Socialist | Hugo Ernst | 9,289 | 15.4 | |
| Total votes | 60,130 | 100.0 | ||
| Turnout | ||||
| Republican hold | ||||
1922
| Party | Candidate | Votes | % | |
|---|---|---|---|---|
| Republican | Julius Kahn (Incumbent) | 46,527 | 83 | |
| Socialist | Hugo Ernst | 9,547 | 17 | |
| Total votes | 56,074 | 100 | ||
| Turnout | ||||
| Republican hold | ||||
1924
| Party | Candidate | Votes | % | |
|---|---|---|---|---|
| Republican | Julius Kahn (Incumbent) | 44,048 | 81 | |
| Socialist | William McDevitt | 10,360 | 19 | |
| Total votes | 54,408 | 100 | ||
| Turnout | ||||
| Republican hold | ||||
1926
| Party | Candidate | Votes | % | |
|---|---|---|---|---|
| Republican | Florence Prag Kahn (Incumbent) | 37,353 | 63.4 | |
| Democratic | Chauncey F. Tramutulo | 18,210 | 32.5 | |
| Socialist | Harry W. Hutton | 2,960 | 5.1 | |
| Total votes | 58,523 | 100.0 | ||
| Turnout | ||||
| Republican hold | ||||
1928
| Party | Candidate | Votes | % | |
|---|---|---|---|---|
| Republican | Florence Prag Kahn (Incumbent) | 50,206 | 76 | |
| Independent | Harry W. Hutton | 16,838 | 24 | |
| Total votes | 67,044 | 100 | ||
| Turnout | ||||
| Republican hold | ||||
1930
| Party | Candidate | Votes | % | |
|---|---|---|---|---|
| Republican | Florence Prag Kahn (Incumbent) | 47,397 | 100.0 | |
| Turnout | ||||
| Republican hold | ||||
1932
| Party | Candidate | Votes | % | |
|---|---|---|---|---|
| Republican | Florence Prag Kahn (Incumbent) | 67,425 | 85.3 | |
| Socialist | Milen C. Dempster | 11,603 | 14.7 | |
| Total votes | 79,028 | 100.0 | ||
| Turnout | ||||
| Republican hold | ||||
1934
| Party | Candidate | Votes | % | |
|---|---|---|---|---|
| Republican | Florence Prag Kahn (Incumbent) | 50,491 | 48.0 | |
| Democratic | Chauncey Tramutolo | 46,871 | 44.5 | |
| Progressive | Raymond A. Burr | 3,636 | 3.5 | |
| Socialist | Samuel S. White | 2,414 | 2.3 | |
| Communist | Minnie Carson | 1,810 | 1.7 | |
| Total votes | 105,222 | 100.0 | ||
| Turnout | ||||
| Republican hold | ||||
1936
| Party | Candidate | Votes | % | |||
|---|---|---|---|---|---|---|
| Progressive | Franck R. Havenner | 64,063 | 58.5 | |||
| Republican | Florence Prag Kahn (Incumbent) | 43,805 | 40.0 | |||
| Communist | Anita Whitney | 1,711 | 1.5 | |||
| Total votes | 109,579 | 100.0 | ||||
| Turnout | ||||||
| Progressive gain from Republican | ||||||
1938
| Party | Candidate | Votes | % | |
|---|---|---|---|---|
| Democratic | Franck R. Havenner (Incumbent) | 64,452 | 61.2 | |
| Republican | Kennett B. Dawson | 40,842 | 38.8 | |
| Total votes | 105,294 | 100.0 | ||
| Turnout | ||||
| Democratic hold | ||||
1940
| Party | Candidate | Votes | % | |||
|---|---|---|---|---|---|---|
| Republican | Thomas Rolph | 75,369 | 54.6 | |||
| Democratic | Franck R. Havenner (Incumbent) | 61,341 | 44.4 | |||
| Communist | Archie Brown | 1,322 | 1.0 | |||
| Total votes | 138,032 | 100.0 | ||||
| Turnout | ||||||
| Republican gain from Democratic | ||||||
1942
| Party | Candidate | Votes | % | |
|---|---|---|---|---|
| Republican | Thomas Rolph (Incumbent) | 62,735 | 98.3 | |
| Communist | Archie Brown (write-in) | 1,116 | 1.7 | |
| Total votes | 63,851 | 100.0 | ||
| Turnout | ||||
| Republican hold | ||||
1944
| Party | Candidate | Votes | % | |||
|---|---|---|---|---|---|---|
| Democratic | Franck R. Havenner | 73,582 | 50.1 | |||
| Republican | Thomas Rolph (Incumbent) | 73,367 | 49.9 | |||
| Total votes | 146,949 | 100.0 | ||||
| Turnout | ||||||
| Democratic gain from Republican | ||||||
1946
| Party | Candidate | Votes | % | |
|---|---|---|---|---|
| Democratic | Franck R. Havenner (Incumbent) | 60,655 | 52.9 | |
| Republican | Truman R. Young | 54,113 | 47.1 | |
| Total votes | 114,768 | 100.0 | ||
| Turnout | ||||
| Democratic hold | ||||
1948
| Party | Candidate | Votes | % | |
|---|---|---|---|---|
| Democratic | Franck R. Havenner (Incumbent) | 73,704 | 51.0 | |
| Republican | William S. Mailliard | 68,875 | 47.7 | |
| Progressive | Francis J. McTernan Jr. | 1,949 | 1.3 | |
| Total votes | 144,528 | 100.0 | ||
| Turnout | ||||
| Democratic hold | ||||
1950
| Party | Candidate | Votes | % | |
|---|---|---|---|---|
| Democratic | Franck R. Havenner (Incumbent) | 83,078 | 67.2 | |
| Republican | Raymond D. Smith | 40,569 | 32.8 | |
| Total votes | 123,647 | 100.0 | ||
| Turnout | ||||
| Democratic hold | ||||
1952
| Party | Candidate | Votes | % | |||
|---|---|---|---|---|---|---|
| Republican | William S. Mailliard | 102,359 | 55 | |||
| Democratic | Franck R. Havenner (Incumbent) | 83,748 | 45 | |||
| Total votes | 186,107 | 100 | ||||
| Turnout | ||||||
| Republican gain from Democratic | ||||||
1954
| Party | Candidate | Votes | % | |
|---|---|---|---|---|
| Republican | William S. Mailliard (Incumbent) | 88,439 | 61.2 | |
| Democratic | Philip A. O'Rourke | 52,980 | 36.7 | |
| Progressive | George R. Andersen | 2,987 | 2.1 | |
| Total votes | 144,406 | 100.0 | ||
| Turnout | ||||
| Republican hold | ||||
1956
| Party | Candidate | Votes | % | |
|---|---|---|---|---|
| Republican | William S. Mailliard (Incumbent) | 109,188 | 61.9 | |
| Democratic | James L. Quigley | 67,132 | 38.1 | |
| Total votes | 176,320 | 100.0 | ||
| Turnout | ||||
| Republican hold | ||||
1958
| Party | Candidate | Votes | % | |
|---|---|---|---|---|
| Republican | William S. Mailliard (Incumbent) | 98,574 | 63.9 | |
| Democratic | George D. Collins Jr. | 65,798 | 36.1 | |
| Total votes | 164,372 | 100.0 | ||
| Turnout | ||||
| Republican hold | ||||
1960
| Party | Candidate | Votes | % | |
|---|---|---|---|---|
| Republican | William S. Mailliard (Incumbent) | 118,249 | 65.3 | |
| Democratic | Phillips S. Davies | 62,814 | 34.7 | |
| Total votes | 181,063 | 100.0 | ||
| Turnout | ||||
| Republican hold | ||||
1962
| Party | Candidate | Votes | % | ||
|---|---|---|---|---|---|
| Democratic | Robert L. Leggett | 55,563 | 56.5 | ||
| Republican | L. V. Honsinger | 42,762 | 43.5 | ||
| Total votes | 98,325 | 100.0 | |||
| Turnout | |||||
| Democratic win (new seat) | |||||
1964
| Party | Candidate | Votes | % | |
|---|---|---|---|---|
| Democratic | Robert L. Leggett (Incumbent) | 84,949 | 71.9 | |
| Republican | Ivan Norris | 33,160 | 28.1 | |
| Total votes | 118,109 | 100.0 | ||
| Turnout | ||||
| Democratic hold | ||||
1966
| Party | Candidate | Votes | % | |
|---|---|---|---|---|
| Democratic | Robert L. Leggett (Incumbent) | 67,942 | 60 | |
| Republican | Tom McHatton | 46,337 | 40 | |
| Total votes | 114,279 | 100.0 | ||
| Turnout | ||||
| Democratic hold | ||||
1968
| Party | Candidate | Votes | % | |
|---|---|---|---|---|
| Democratic | Robert L. Leggett (Incumbent) | 88,067 | 55.5 | |
| Republican | James Shumway | 65,942 | 41.6 | |
| American Independent | Gene Clark | 4,545 | 2.9 | |
| Total votes | 158,554 | 100.0 | ||
| Turnout | ||||
| Democratic hold | ||||
1970
| Party | Candidate | Votes | % | |
|---|---|---|---|---|
| Democratic | Robert L. Leggett (Incumbent) | 103,485 | 68 | |
| Republican | Andrew Gyorke | 48,783 | 32 | |
| Total votes | 152,268 | 100 | ||
| Turnout | ||||
| Democratic hold | ||||
1972
| Party | Candidate | Votes | % | |
|---|---|---|---|---|
| Democratic | Robert L. Leggett (Incumbent) | 114,673 | 67.4 | |
| Republican | Benjamin Chang | 55,367 | 32.6 | |
| Total votes | 170,040 | 100.0 | ||
| Turnout | ||||
| Democratic hold | ||||
1974
| Party | Candidate | Votes | % | |
|---|---|---|---|---|
| Democratic | Robert L. Leggett (Incumbent) | 100,934 | 100.0 | |
| Turnout | ||||
| Democratic hold | ||||
1976
| Party | Candidate | Votes | % | |
|---|---|---|---|---|
| Democratic | Robert L. Leggett (Incumbent) | 75,844 | 50.2 | |
| Republican | Rex Hime | 75,193 | 49.8 | |
| Total votes | 151,037 | 100.0 | ||
| Turnout | ||||
| Democratic hold | ||||
1978
| Party | Candidate | Votes | % | |
|---|---|---|---|---|
| Democratic | Vic Fazio | 87,764 | 55.4 | |
| Republican | Rex Hime | 70,733 | 44.6 | |
| Total votes | 158,497 | 100.0 | ||
| Turnout | ||||
| Democratic hold | ||||
1980
| Party | Candidate | Votes | % | |
|---|---|---|---|---|
| Democratic | Vic Fazio (Incumbent) | 133,853 | 65.3 | |
| Republican | Albert Dehr | 60,935 | 29.7 | |
| Libertarian | Robert J. Burnside | 10,267 | 5.0 | |
| Total votes | 205,055 | 100.0 | ||
| Turnout | ||||
| Democratic hold | ||||
1982
| Party | Candidate | Votes | % | |
|---|---|---|---|---|
| Democratic | Vic Fazio (Incumbent) | 118,476 | 63.9 | |
| Republican | Roger B. Canfield | 67,047 | 36.1 | |
| Total votes | 185,523 | 100.0 | ||
| Turnout | ||||
| Democratic hold | ||||
1984
| Party | Candidate | Votes | % | |
|---|---|---|---|---|
| Democratic | Vic Fazio (Incumbent) | 130,109 | 61.4 | |
| Republican | Roger B. Canfield | 77,773 | 36.7 | |
| Libertarian | Roger Conant Pope | 4,039 | 1.9 | |
| Total votes | 211,921 | 100.0 | ||
| Turnout | ||||
| Democratic hold | ||||
1986
| Party | Candidate | Votes | % | |
|---|---|---|---|---|
| Democratic | Vic Fazio (Incumbent) | 128,364 | 70.2 | |
| Republican | Jack D. Hite | 54,596 | 29.8 | |
| Total votes | 182,960 | 100.0 | ||
| Turnout | ||||
| Democratic hold | ||||
1988
| Party | Candidate | Votes | % | |
|---|---|---|---|---|
| Democratic | Vic Fazio (Incumbent) | 181,184 | 100.0 | |
| No party | Write-ins | 1,306 | 0.0 | |
| Turnout | ||||
| Democratic hold | ||||
1990
| Party | Candidate | Votes | % | |
|---|---|---|---|---|
| Democratic | Vic Fazio (Incumbent) | 115,090 | 54.7 | |
| Republican | Mark R. Baughman | 82,738 | 39.3 | |
| Libertarian | Bryce Bigwood | 12,626 | 6.0 | |
| Total votes | 210,454 | 100.0 | ||
| Turnout | ||||
| Democratic hold | ||||
1992
| Party | Candidate | Votes | % | |
|---|---|---|---|---|
| Republican | John Doolittle (Incumbent) | 141,155 | 49.8 | |
| Democratic | Patricia Malberg | 129,489 | 45.7 | |
| Libertarian | Patrick Lee McHargue | 12,705 | 4.5 | |
| No party | Brooksher (write-in) | 16 | 0.0 | |
| Total votes | 283,265 | 100.0 | ||
| Turnout | ||||
| Republican hold | ||||
1994
| Party | Candidate | Votes | % | |
|---|---|---|---|---|
| Republican | John Doolittle (Incumbent) | 144,936 | 61.33 | |
| Democratic | Katie Hirning | 82,505 | 34.91 | |
| Libertarian | Damon C. Falconi | 8,882 | 3.76 | |
| Total votes | 236,323 | 100.0 | ||
| Turnout | ||||
| Republican hold | ||||
1996
| Party | Candidate | Votes | % | |
|---|---|---|---|---|
| Republican | John Doolittle (Incumbent) | 164,048 | 60.5 | |
| Democratic | Katie Hirning | 97,948 | 36.1 | |
| Libertarian | Patrick McHargue | 9,319 | 3.4 | |
| Total votes | 271,315 | 100.0 | ||
| Turnout | ||||
| Republican hold | ||||
1998
| Party | Candidate | Votes | % | |
|---|---|---|---|---|
| Republican | John Doolittle (Incumbent) | 155,306 | 62.57 | |
| Democratic | David Shapiro | 85,394 | 34.40 | |
| Libertarian | Dan Winterrowd | 7,524 | 3.03 | |
| Total votes | 248,224 | 100.0 | ||
| Turnout | ||||
| Republican hold | ||||
2000
| Party | Candidate | Votes | % | |
|---|---|---|---|---|
| Republican | John Doolittle (Incumbent) | 197,503 | 63.5 | |
| Democratic | Mark A. Norberg | 97,974 | 31.5 | |
| Libertarian | William Fritz Frey | 9,494 | 3.0 | |
| Natural Law | Robert E. Ray | 6,452 | 2.0 | |
| Total votes | 311,423 | 100.0 | ||
| Turnout | ||||
| Republican hold | ||||
2002
| Party | Candidate | Votes | % | |
|---|---|---|---|---|
| Republican | John Doolittle (Incumbent) | 139,280 | 64.9 | |
| Democratic | Mark A. Norberg | 68,755 | 32.0 | |
| Libertarian | Allen M. Roberts | 6,834 | 3.1 | |
| Total votes | 214,869 | 100.0 | ||
| Turnout | ||||
| Republican hold | ||||
2004
| Party | Candidate | Votes | % | |
|---|---|---|---|---|
| Republican | John Doolittle (Incumbent) | 221,926 | 65.4 | |
| Democratic | David I. Winters | 117,443 | 34.6 | |
| Total votes | 339,369 | 100.0 | ||
| Turnout | ||||
| Republican hold | ||||
2006
| Party | Candidate | Votes | % | |
|---|---|---|---|---|
| Republican | John Doolittle (Incumbent) | 135,818 | 49.1 | |
| Democratic | Charlie Brown | 126,999 | 45.9 | |
| Libertarian | Dan Warren | 14,076 | 5.0 | |
| Total votes | 213,984 | 100.0 | ||
| Turnout | ||||
| Republican hold | ||||
2008
| Party | Candidate | Votes | % | |
|---|---|---|---|---|
| Republican | Tom McClintock | 184,543 | 50.3 | |
| Democratic | Charlie Brown | 182,967 | 49.7 | |
| Total votes | 367,510 | 100.0 | ||
| Turnout | ||||
| Republican hold | ||||
2010
| Party | Candidate | Votes | % | |
|---|---|---|---|---|
| Republican | Tom McClintock | 186,392 | 61% | |
| Democratic | Clint Curtis | 95,653 | 31% | |
| Green | Benjamin Emery | 22,179 | 8% | |
| Total votes | 304,224 | 100% | ||
| Turnout | ||||
| Republican hold | ||||
2012
| Party | Candidate | Votes | % | |
|---|---|---|---|---|
| Republican | Tom McClintock (Incumbent) | 197,803 | 61.1% | |
| Democratic | Jack Uppal | 125,885 | 38.9% | |
| Total votes | 323,688 | 100.0% | ||
| Republican hold | ||||
2014
| Party | Candidate | Votes | % | |
|---|---|---|---|---|
| Republican | Tom McClintock (Incumbent) | 126,784 | 60.0% | |
| Republican | Arthur "Art" Moore | 84,350 | 40.0% | |
| Total votes | 211,134 | 100.0% | ||
| Republican hold | ||||
2016
| Party | Candidate | Votes | % | |
|---|---|---|---|---|
| Republican | Tom McClintock (Incumbent) | 220,133 | 62.7% | |
| Democratic | Robert W. Derlet | 130,845 | 37.3% | |
| Total votes | 350,978 | 100.0% | ||
| Republican hold | ||||
2018
| Party | Candidate | Votes | % | |
|---|---|---|---|---|
| Republican | Tom McClintock | 184,401 | 54.1% | |
| Democratic | Jessica Morse | 156,253 | 45.9% | |
| Total votes | 340,654 | 100% | ||
| Turnout | ||||
| Republican hold | ||||
In 2018, six Democratic candidates filed statements of candidacy with the Federal Election Commission (FEC).[72] They were, in alphabetical order by last name: Regina Bateson; Roza Calderon; Richard Martin; Robert Lawton; Jessica Morse; and Rochelle Wilcox. Martin and Wilcox[73] dropped out of the race, with Wilcox[74] endorsing Morse in February.
Retired Air Force Lieutenant Colonel Charlie Brown, who was the Democratic nominee for this seat in 2006 and 2008, was "seriously considering" running in 2018,[75] but decided in June 2017 against a third campaign. In January 2018, Brown endorsed Morse for the nomination.[76] Bob Derlet,[77] the Democratic nominee in 2016, also endorsed Morse in January.
On the Republican side, McClintock had one challenger, Mitchell Kendrick White, who filed with the FEC in January.[78]
In February, the California Democratic Party (CDP) endorsed[79] Jessica Morse in a contested nomination. Roza Calderon was able to successfully collect 322 CDP-credentialed delegate signatures needed to block the endorsement, in which Morse only received 44 delegate votes. However, CDP staff refused to accept the forms after it was alleged they closed doors early to prevent the submission. A petition was later filed with the Compliance Review Commission (CRC)[80] by Calderon. The CRC voted to accept and count the signatures, ultimately disqualifying enough signatures to proceed with Morse's endorsement.
California allows candidates to include their professional description under their names on the ballot. Regina Bateson challenged Morse's ballot designation title of "National Security Fellow" at the Sacramento Superior Court after months of controversy that Morse, who had not worked in three years, was "fluffing" her credentials.[81] California's Secretary of State, Alex Padilla, struck down Morse's three ballot designations before Judge Gevercer ruled[82] that she presented "no credible evidence" to use the ballot designation of "National Security Fellow". Instead, he held that this title would mislead the average person about her recent activities. In the official Certified Candidate List for the primary election,[83] Morse's ballot designation was left blank.
Under the California nonpartisan blanket ("jungle") primary system, only the two candidates with the most votes on June 5, regardless of party, went on to the general election on November 6. Two Republicans and four Democrats appeared on the primary ballot.[79] Morse finished second, qualifying for the general election ballot, along with McClintock.
For the November ballot, Morse was also denied "National Security" as her designation.[84] In the November general election, McClintock held the district with an advantage of more than eight percentage points.[85]
2020
| Party | Candidate | Votes | % | |
|---|---|---|---|---|
| Republican | Tom McClintock (incumbent) | 247,291 | 55.9 | |
| Democratic | Brynne S. Kennedy | 194,731 | 44.1 | |
| Total votes | 442,022 | 100.0 | ||
| Republican hold | ||||
2022
| Party | Candidate | Votes | % | |
|---|---|---|---|---|
| Democratic | Mike Thompson (incumbent) | 176,900 | 67.8 | |
| Republican | Matt Brock | 84,007 | 32.2 | |
| Total votes | 260,907 | 100.0 | ||
| Democratic hold | ||||
See also


References
External links
- GovTrack.us: California's 4th congressional district
- California Citizens Redistricting Commission: wedrawthelines.ca.gov 2012 final district maps