The 1964 United States Senate election in Maryland was held on November 3, 1964.
| |||||||||||||||||
| |||||||||||||||||
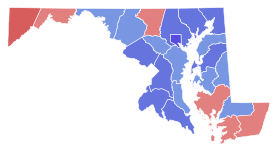
 County results Tydings: 50–60% 60–70% 70–80% Beall: 50-60% 60-70% | |||||||||||||||||
| |||||||||||||||||
Incumbent Republican Senator James Glenn Beall ran for re-election to a third term, but was defeated by Democratic former State Representative Joseph D. Tydings in a landslide.
Tydings was the adopted son of former Senator Millard Tydings.
Republican primary
Candidates
- William A. Albaugh
- James Glenn Beall, incumbent senator
- James P. Gleason, candidate for Senate in 1962 and former assistant to Senators Richard Nixon and William F. Knowland
- Henry J. Lague, Jr., perennial candidate
Results
| Party | Candidate | Votes | % | |
|---|---|---|---|---|
| Republican | James Glenn Beall (incumbent) | 68,930 | 59.79% | |
| Republican | James P. Gleason | 35,645 | 30.92% | |
| Republican | William A. Albaugh | 8,352 | 7.24% | |
| Republican | Henry J. Lague | 2,370 | 2.06% | |
| Total votes | 115,297 | 100.00% | ||
Democratic primary
Candidates
- Morgan L. Amiamo, perennial candidate
- Louis L. Goldstein, Maryland Comptroller
- John J. Harbaugh
- Joseph D. Tydings, former State Representative and son of former Senator Millard Tydings
Results
| Party | Candidate | Votes | % | |
|---|---|---|---|---|
| Democratic | Joseph D. Tydings | 279,564 | 59.08% | |
| Democratic | Louis L. Goldstein | 155,086 | 32.77% | |
| Democratic | John J. Harbaugh | 22,665 | 4.79% | |
| Democratic | Morgan Amiamo | 15,921 | 3.36% | |
| Total votes | 473,236 | 100.00% | ||
General election
Results
| Party | Candidate | Votes | % | ±% | ||
|---|---|---|---|---|---|---|
| Democratic | Joseph D. Tydings | 678,649 | 62.78% |  13.96 13.96 | ||
| Republican | James Glenn Beall (incumbent) | 402,393 | 37.22% |  13.96 13.96 | ||
| Total votes | 1,081,042 | 100.00% | ||||
| Democratic gain from Republican | ||||||
Results by county
| County | Joseph D. Tydings Democratic | J. Glenn Beall Republican | Margin | Total Votes Cast | |||
|---|---|---|---|---|---|---|---|
| # | % | # | % | # | % | ||
| Allegany | 14402 | 44.46% | 17994 | 55.54% | -3592 | -11.09% | 32396 |
| Anne Arundel | 35846 | 57.42% | 26585 | 42.58% | 9261 | 14.83% | 62431 |
| Baltimore | 116269 | 60.52% | 75849 | 39.48% | 40420 | 21.04% | 192118 |
| Baltimore City | 218520 | 71.92% | 85318 | 28.08% | 133202 | 43.84% | 303838 |
| Calvert | 2664 | 56.05% | 2089 | 43.95% | 575 | 12.10% | 4753 |
| Caroline | 3514 | 59.10% | 2432 | 40.90% | 1082 | 18.20% | 5946 |
| Carroll | 8045 | 49.17% | 8318 | 50.83% | -273 | -1.67% | 16363 |
| Cecil | 7738 | 61.59% | 4825 | 38.41% | 2913 | 23.19% | 12563 |
| Charles | 6049 | 63.43% | 3488 | 36.57% | 2561 | 26.85% | 9537 |
| Dorchester | 4425 | 49.50% | 4514 | 50.50% | -89 | -1.00% | 8939 |
| Frederick | 12400 | 53.53% | 10766 | 46.47% | 1634 | 7.05% | 23166 |
| Garrett | 2650 | 38.51% | 4232 | 61.49% | -1582 | -22.99% | 6882 |
| Harford | 15475 | 66.30% | 7867 | 33.70% | 7608 | 32.59% | 23342 |
| Howard | 8083 | 54.78% | 6673 | 45.22% | 1410 | 9.56% | 14756 |
| Kent | 3443 | 58.78% | 2414 | 41.22% | 1029 | 17.57% | 5857 |
| Montgomery | 93878 | 61.28% | 59311 | 38.72% | 34567 | 22.56% | 153189 |
| Prince George's | 80726 | 65.00% | 43472 | 35.00% | 37254 | 30.00% | 124198 |
| Queen Anne's | 3778 | 66.93% | 1867 | 33.07% | 1911 | 33.85% | 5645 |
| St. Mary's | 5234 | 64.28% | 2908 | 35.72% | 2326 | 28.57% | 8142 |
| Somerset | 3170 | 46.71% | 3617 | 53.29% | -447 | -6.59% | 6787 |
| Talbot | 4305 | 56.17% | 3359 | 43.83% | 946 | 12.34% | 7664 |
| Washington | 17631 | 55.29% | 14258 | 44.71% | 3373 | 10.58% | 31889 |
| Wicomico | 7641 | 51.56% | 7178 | 48.44% | 463 | 3.12% | 14819 |
| Worcester | 2763 | 47.46% | 3059 | 52.54% | -296 | -5.08% | 5822 |
| Total | 678649 | 62.78% | 402393 | 37.22% | 276256 | 25.55% | 1081042 |
Counties that flipped from Republican to Democratic
- Anne Arundel
- Baltimore (County)
- Baltimore (City)
- Caroline
- Cecil
- Charles
- Frederick
- Harford
- Howard
- Kent
- Montgomery
- Talbot
- Washington
- Wicomico
Counties that flipped from Democratic to Republican
See also
References
🔥 Top keywords: Main PageSpecial:SearchPage 3Wikipedia:Featured picturesHouse of the DragonUEFA Euro 2024Bryson DeChambeauJuneteenthInside Out 2Eid al-AdhaCleopatraDeaths in 2024Merrily We Roll Along (musical)Jonathan GroffJude Bellingham.xxx77th Tony AwardsBridgertonGary PlauchéKylian MbappéDaniel RadcliffeUEFA European Championship2024 ICC Men's T20 World CupUnit 731The Boys (TV series)Rory McIlroyN'Golo KantéUEFA Euro 2020YouTubeRomelu LukakuOpinion polling for the 2024 United Kingdom general electionThe Boys season 4Romania national football teamNicola CoughlanStereophonic (play)Gene WilderErin DarkeAntoine GriezmannProject 2025

