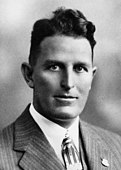
Elections were held in the Australian state of Queensland on 3 May 1947 to elect the 62 members of the state's Legislative Assembly.
| |||||||||||||||||||||||||||||||||||||||||||||||||||||||||||||||||||||||||||||||||||
All 62 seats in the Legislative Assembly 32 seats are needed for a majority | |||||||||||||||||||||||||||||||||||||||||||||||||||||||||||||||||||||||||||||||||||
|---|---|---|---|---|---|---|---|---|---|---|---|---|---|---|---|---|---|---|---|---|---|---|---|---|---|---|---|---|---|---|---|---|---|---|---|---|---|---|---|---|---|---|---|---|---|---|---|---|---|---|---|---|---|---|---|---|---|---|---|---|---|---|---|---|---|---|---|---|---|---|---|---|---|---|---|---|---|---|---|---|---|---|---|
| Registered | 697,405 | ||||||||||||||||||||||||||||||||||||||||||||||||||||||||||||||||||||||||||||||||||
| Turnout | 632,909 (90.75%) ( | ||||||||||||||||||||||||||||||||||||||||||||||||||||||||||||||||||||||||||||||||||
| |||||||||||||||||||||||||||||||||||||||||||||||||||||||||||||||||||||||||||||||||||
 Legislative Assembly after the election | |||||||||||||||||||||||||||||||||||||||||||||||||||||||||||||||||||||||||||||||||||
| |||||||||||||||||||||||||||||||||||||||||||||||||||||||||||||||||||||||||||||||||||
The election was the first that the Labor government had contested under Premier Ned Hanlon, who had been in office for 14 months by the time of the poll.
The election resulted in Labor receiving a sixth term in office. It was the first Queensland election at which all seats were contested by at least two candidates.
Key dates
| Date | Event |
|---|---|
| 21 March 1947 | The Parliament was dissolved.[2] |
| 24 March 1947 | Writs were issued by the Governor to proceed with an election.[3] |
| 31 March 1947 | Close of nominations. |
| 3 May 1947 | Polling day, between the hours of 8am and 6pm. |
| 15 May 1947 | The Hanlon Ministry was re-sworn in.[4] |
| 24 May 1947 | Polling day in the seat of Gregory.[5] |
| 30 May 1947 | The writ was returned and the results formally declared. |
| 2 June 1947 | Polling day in the seat of Cook.[5] |
| 5 August 1947 | Parliament resumed for business.[6] |
Results
 | |||||||||
| Party | Primary vote | Seats | |||||||
|---|---|---|---|---|---|---|---|---|---|
| Votes | % | Swing (pp) | Seats | Change | |||||
| Labor | 272,203 | 43.00 | –3.23 | 35 |  4 4 | ||||
| Country | 129,158[b] | 20.40 | +3.12 | 14 |  3 3 | ||||
| People's Party | 160,623 | 25.38 | +1.09 | 9 |  2 2 | ||||
| Frank Barnes Labor | 21,823 | 3.45 | +2.63 | 1 |  1 1 | ||||
| Communist | 7,870 | 1.24 | –1.19 | 1 |  | ||||
| Independent Labor | 6,727 | 1.06 | +1.06 | 1 |  1 1 | ||||
| Hermit Park Labor | 4,541 | 0.72 | –0.36 | 1 |  | ||||
| King O'Malley Labor | 3,061 | 0.48 | –0.65 | 0 |  | ||||
| Co-operative Democrat | 702[c] | 0.11 | +0.08 | 0 |  | ||||
| Independent | 17,722 | 2.80 | –1.82 | 0 |  1 1 | ||||
| Total | 632,909 | 100.00 | 62 |  | |||||
| Invalid/blank votes | 8,579 | 1.4 | –0.42 | — | |||||
| Turnout | 632,909 | 90.75 | +12.58 | — | |||||
| Registered voters | 697,405 | — | — | ||||||
Seats changing party representation
This table lists changes in party representation at the 1947 election.
| Seat | Incumbent member | Party | New member | Party | ||
|---|---|---|---|---|---|---|
| Cairns | Lou Barnes | Frank Barnes Labor | Thomas Crowley | Labor | ||
| Dalby | Aubrey Slessar | Labor | Charles Russell | Country | ||
| East Toowoomba | Les Wood | Labor | Gordon Chalk | People's Party | ||
| Maree | Louis Luckins | Independent | Louis Luckins | People's Party | ||
| Mirani | Ted Walsh | Labor | Ernie Evans | Country | ||
| Warwick | John Healy | Labor | Otto Madsen | Country | ||
- Members listed in italics did not recontest their seats.
- East Toowoomba was held by the Country Party at the previous election. It was won by Labor at the 1946 by-election.
See also
Notes
References
🔥 Top keywords: Main PageSpecial:SearchPage 3Wikipedia:Featured picturesHouse of the DragonUEFA Euro 2024Bryson DeChambeauJuneteenthInside Out 2Eid al-AdhaCleopatraDeaths in 2024Merrily We Roll Along (musical)Jonathan GroffJude Bellingham.xxx77th Tony AwardsBridgertonGary PlauchéKylian MbappéDaniel RadcliffeUEFA European Championship2024 ICC Men's T20 World CupUnit 731The Boys (TV series)Rory McIlroyN'Golo KantéUEFA Euro 2020YouTubeRomelu LukakuOpinion polling for the 2024 United Kingdom general electionThe Boys season 4Romania national football teamNicola CoughlanStereophonic (play)Gene WilderErin DarkeAntoine GriezmannProject 2025


