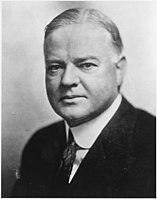
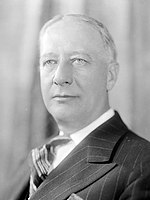
The 1928 United States presidential election in Maryland took place on November 6, 1928 as part of the 1928 United States presidential election. Voters chose eight representatives, or electors to the Electoral College, who voted for president and vice president.
| ||||||||||||||||||||||||||
| ||||||||||||||||||||||||||
 County Results | ||||||||||||||||||||||||||
| ||||||||||||||||||||||||||
Herbert Hoover would win Maryland by a margin of 14.73 percent against Al Smith. Hoover won all eight of the state's electoral votes as a result. Despite Hoover's landslide win, Maryland voted 2.68% more Democratic than the nation at-large.[1] Hoover became the first ever Republican victor in Wicomico and Worcester counties.[2] Maryland would not vote Republican again until 1948.[3]
Results
| 1928 United States presidential election in Maryland | ||||||||
|---|---|---|---|---|---|---|---|---|
| Party | Candidate | Running mate | Popular vote | Electoral vote | ||||
| Count | % | Count | % | |||||
| Republican | Herbert Hoover of California | Charles Curtis of Kansas | 301,479 | 57.06% | 8 | 100% | ||
| Democratic | Al Smith of New York | Joseph Taylor Robinson of Arkansas | 223,626 | 42.33% | 0 | 0.00% | ||
| Socialist | Norman Thomas of New York | James Hudson Maurer of Pennsylvania | 1,701 | 0.32% | 0 | 0.00% | ||
| Socialist Labor | Verne L. Reynolds of Michigan | Jeremiah D. Crowley of New York | 906 | 0.17 | 0 | 0.00% | ||
| Communist | William Z. Foster of Massachusetts | Benjamin Gitlow of New York | 636 | 0.12 | 0 | 0.00% | ||
| Total | 828,348 | 100% | 8 | 100% | ||||
Results by county
| County | Herbert Clark Hoover Republican | Alfred Emmanual Smith Democratic | Norman Mattoon Thomas Socialist | Verne L. Reynolds Labor | William Z. Foster Workers’ Party America | Margin | Total votes cast[4] | ||||||
|---|---|---|---|---|---|---|---|---|---|---|---|---|---|
| # | % | # | % | # | % | # | % | # | % | # | % | ||
| Allegany | 19,443 | 67.74% | 9,026 | 31.45% | 144 | 0.50% | 62 | 0.22% | 28 | 0.10% | 10,417 | 36.29% | 28,703 |
| Anne Arundel | 10,145 | 61.54% | 6,259 | 37.97% | 29 | 0.18% | 43 | 0.26% | 10 | 0.06% | 3,886 | 23.57% | 16,486 |
| Baltimore | 23,889 | 60.17% | 15,632 | 39.37% | 81 | 0.20% | 77 | 0.19% | 22 | 0.06% | 8,257 | 20.80% | 39,701 |
| Baltimore City | 135,182 | 51.39% | 126,106 | 47.94% | 1,093 | 0.42% | 356 | 0.14% | 321 | 0.12% | 9,076 | 3.45% | 263,058 |
| Calvert | 2,085 | 63.92% | 1,144 | 35.07% | 22 | 0.67% | 7 | 0.21% | 4 | 0.12% | 941 | 28.85% | 3,262 |
| Caroline | 3,270 | 61.44% | 2,030 | 38.14% | 6 | 0.11% | 5 | 0.09% | 11 | 0.21% | 1,240 | 23.30% | 5,322 |
| Carroll | 8,644 | 69.60% | 3,731 | 30.04% | 21 | 0.17% | 18 | 0.14% | 5 | 0.04% | 4,913 | 39.56% | 12,419 |
| Cecil | 5,706 | 71.67% | 2,201 | 27.64% | 32 | 0.40% | 17 | 0.21% | 6 | 0.08% | 3,505 | 44.02% | 7,962 |
| Charles | 2,522 | 57.44% | 1,860 | 42.36% | 4 | 0.09% | 4 | 0.09% | 1 | 0.02% | 662 | 15.08% | 4,391 |
| Dorchester | 6,333 | 74.20% | 2,180 | 25.54% | 12 | 0.14% | 7 | 0.08% | 3 | 0.04% | 4,153 | 48.66% | 8,535 |
| Frederick | 12,569 | 62.57% | 7,406 | 36.87% | 45 | 0.22% | 36 | 0.18% | 33 | 0.16% | 5,163 | 25.70% | 20,089 |
| Garrett | 4,371 | 78.38% | 1,168 | 20.94% | 21 | 0.38% | 8 | 0.14% | 9 | 0.16% | 3,203 | 57.43% | 5,577 |
| Harford | 6,479 | 64.53% | 3,506 | 34.92% | 16 | 0.16% | 25 | 0.25% | 14 | 0.14% | 2,973 | 29.61% | 10,040 |
| Howard | 3,296 | 51.36% | 3,088 | 48.12% | 4 | 0.06% | 16 | 0.25% | 13 | 0.20% | 208 | 3.24% | 6,417 |
| Kent | 2,777 | 52.82% | 2,450 | 46.60% | 8 | 0.15% | 14 | 0.27% | 8 | 0.15% | 327 | 6.22% | 5,257 |
| Montgomery | 9,318 | 57.74% | 6,739 | 41.76% | 34 | 0.21% | 25 | 0.15% | 23 | 0.14% | 2,579 | 15.98% | 16,139 |
| Prince George's | 9,782 | 59.06% | 6,658 | 40.20% | 43 | 0.26% | 23 | 0.14% | 56 | 0.34% | 3,124 | 18.86% | 16,562 |
| Queen Anne's | 2,666 | 49.47% | 2,700 | 50.10% | 1 | 0.02% | 21 | 0.39% | 1 | 0.02% | -34 | -0.63% | 5,389 |
| Somerset | 5,071 | 68.57% | 2,277 | 30.79% | 16 | 0.22% | 26 | 0.35% | 5 | 0.07% | 2,794 | 37.78% | 7,395 |
| St. Mary's | 1,609 | 34.00% | 3,006 | 63.51% | 9 | 0.19% | 65 | 1.37% | 44 | 0.93% | -1,397 | -29.52% | 4,733 |
| Talbot | 3,990 | 61.93% | 2,432 | 37.75% | 2 | 0.03% | 17 | 0.26% | 2 | 0.03% | 1,558 | 24.18% | 6,443 |
| Washington | 12,404 | 67.78% | 5,816 | 31.78% | 46 | 0.25% | 28 | 0.15% | 7 | 0.04% | 6,588 | 36.00% | 18,301 |
| Wicomico | 5,923 | 59.04% | 4,095 | 40.82% | 6 | 0.06% | 4 | 0.04% | 5 | 0.05% | 1,828 | 18.22% | 10,033 |
| Worcester | 4,005 | 65.29% | 2,116 | 34.50% | 6 | 0.10% | 2 | 0.03% | 5 | 0.08% | 1,889 | 30.80% | 6,134 |
| Total | 301,479 | 57.06% | 223,626 | 42.33% | 1,701 | 0.32% | 906 | 0.17% | 636 | 0.12% | 77,853 | 14.74% | 528,348 |
Counties that flipped from Democratic to Republican
See also
References
🔥 Top keywords: Main PageSpecial:SearchPage 3Wikipedia:Featured picturesHouse of the DragonUEFA Euro 2024Bryson DeChambeauJuneteenthInside Out 2Eid al-AdhaCleopatraDeaths in 2024Merrily We Roll Along (musical)Jonathan GroffJude Bellingham.xxx77th Tony AwardsBridgertonGary PlauchéKylian MbappéDaniel RadcliffeUEFA European Championship2024 ICC Men's T20 World CupUnit 731The Boys (TV series)Rory McIlroyN'Golo KantéUEFA Euro 2020YouTubeRomelu LukakuOpinion polling for the 2024 United Kingdom general electionThe Boys season 4Romania national football teamNicola CoughlanStereophonic (play)Gene WilderErin DarkeAntoine GriezmannProject 2025

